
Page 240 - Demo
P. 240
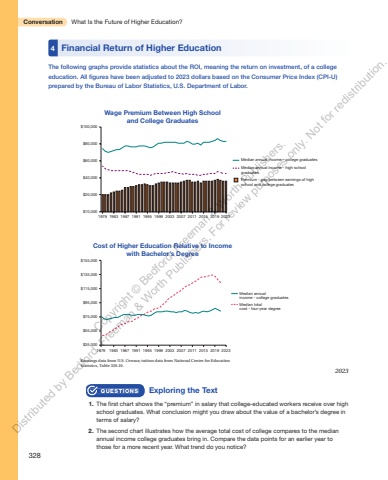
328Conversation What Is the Future of Higher Education?Cost of Higher Education Relative to Incomewith Bachelor%u2019s Degree$35,000$75,000$95,000$115,000$135,000$155,0001979 1983 1987 1991 1995 1999 2003 2007 2011 2015$55,0002019 2023Median totalcost - four-year degreeMedian annualincome - college graduatesEarnings data from U.S. Census; tuition data from National Center for EducationStatistics, Table 330.10.Financial Return of Higher Education QUESTIONS Exploring the Text 1. The first chart shows the %u201cpremium%u201d in salary that college-educated workers receive over high school graduates. What conclusion might you draw about the value of a bachelor%u2019s degree in terms of salary? 2. The second chart illustrates how the average total cost of college compares to the median annual income college graduates bring in. Compare the data points for an earlier year to those for a more recent year. What trend do you notice? QUESTIONS The following graphs provide statistics about the ROI, meaning the return on investment, of a college education. All figures have been adjusted to 2023 dollars based on the Consumer Price Index (CPI-U) prepared by the Bureau of Labor Statistics, U.S. Department of Labor. 4 Wage Premium Between High Schooland College Graduates$10,000$20,000$40,000$60,000$80,000$100,0001979 1983 1987 1991 1995 1999 2003 2007 2011 2015 2019 2023Median annual income - college graduatesMedian annual income - high schoolgraduates Premium - gap between earnings of highschool and college graduates2023Copyright %u00a9 Bedford, Freeman & Worth Publishers. Distributed by Bedford, Freeman & Worth Publishers. For review purposes only. Not for redistribution.
