
Page 59 - Demo
P. 59
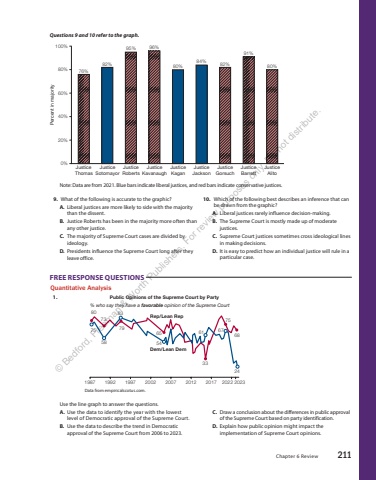
Chapter 6 Review 211Questions 9 and 10 refer to the graph.0%76%82%95% 96%80%84% 82%91%80%20%40%60%80%100%Percent in majorityJustice ThomasJusticeSotomayorJusticeRobertsJusticeKavanaughJusticeKaganJusticeJacksonJusticeGorsuchJusticeBarrettJusticeAlito Note: Data are from 2021. Blue bars indicate liberal justices, and red bars indicate conservative justices.Use the line graph to answer the questions.A. Use the data to identify the year with the lowest level%u00a0of Democratic approval of the Supreme Court.B. Use the data to describe the trend in Democratic approval of the Supreme Court from 2006 to 2023.C. Draw a conclusion about the differences in public approvalof the Supreme Court based on party identification.D. Explain how public opinion might impact the implementation of Supreme Court opinions.9. What of the following is accurate to the graphic?A. Liberal justices are more likely to side with the majority than the dissent.B. Justice Roberts has been in the majority more often than any other justice.C. The majority of Supreme Court cases are divided by ideology.D. Presidents influence the Supreme Court long after they leave office.10. Which of the following best describes an inference that can be drawn from the graphic?A. Liberal justices rarely influence decision-making.B. The Supreme Court is mostly made up of moderate justices.C. Supreme Court justices sometimes cross ideological lines in making decisions.D. It is easy to predict how an individual justice will rule in a particular case.FREE RESPONSE QUESTIONS%u00a0Quantitative Analysis83738075581987 1992 1997 2002 2007 2012 2017 2022 2023795465 613324677568Rep/Lean RepDem/Lean Dem% who say they have a favorable opinion of the Supreme Court1. Public Opinions of the Supreme Court by PartyData from empiricalscotus.com.%u00a9 Bedford, Freeman & Worth Publishers. For review purposes only. Do not distribute.
