
Page 10 - 2023-bfw-APES-4e-new.indd
P. 10
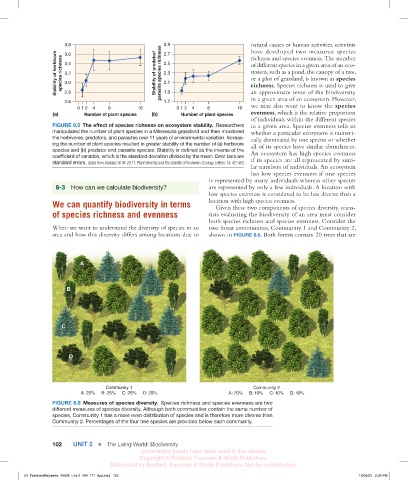
3.8
                                                        Stability of herbivore
                                                           3.6
                                                          species richness
                                                           3.4
                                                           3.2
                                                           3.0
                                                           2.8
                                                           2.6
                                                                0 12  4    8         16
                                                       (a)        Number of plant species
                        3.8                                2.7                            natural causes or human activities,  scientists
                                                                                          have developed two measures: species
                     Stability of herbivore  species richness  3.4  Stability of predator/ parasite species richness 2.9  of different species in a given area of an eco-
                        3.6
                                                                                            richness and species evenness. The number
                                                           2.5
                                                                                          system, such as a pond, the canopy of a tree,
                                                           2.3
                        3.2
                                                                                          or a plot of grassland, is known as  species
                        3.0
                                                           2.1
                                                                                          richness. Species richness is used to give
                        2.8
                                                                                          in a given area of an ecosystem. However,
                        2.6                                1.9                            an approximate sense of the biodiversity
                                                           1.7
                            0 12  4    8          16            0 12  4   8          16   we may also want to know the species
                    (a)        Number of plant species  (b)      Number of plant species  evenness, which is the relative proportion
                                                                                          of individuals within the different species
                    FIGURE 8.5  The effect of species richness on ecosystem stability.  Researchers   in a given area. Species evenness tells us
                    manipulated the number of plant species in a Minnesota grassland and then monitored   whether a particular ecosystem is numeri-
                       parasite species richness 2.9
                    the herbivores, predators, and parasites over 11 years of environmental variation. Increas-  cally dominated by one species or whether
                    ing the number of plant species resulted in greater stability of the number of (a) herbivore   all of its species have similar abundances.
                     Stability of predator/  2.3                                          lar numbers of individuals. An ecosystem
                        2.7
                    species and (b) predator and parasite species. Stability is defined as the inverse of the   An ecosystem has high species evenness
                        2.5
                    coefficient of variation, which is the standard deviation divided by the mean. Error bars are   if its species are all represented by simi-
                    standard errors. (Data from Haddad, N. M. 2011. Plant diversity and the stability of foodwebs. Ecology Letters 14: 42–46.)
                                                                                          has low species evenness if one species
                        2.1
                        1.9
                                                                           are represented by only a few individuals. A location with
                     8-3   How can we calculate biodiversity?              is represented by many individuals whereas other species
                        1.7                                                low species evenness is considered to be less diverse than a
                                       8
                                  4
                            0 12
                                                  16
                    We can quantify biodiversity in terms                  location with high  species evenness.
                    (b)
                              Number of plant species
                                                                              Given these two components of species diversity, scien-
                    of species richness and evenness                       tists evaluating the biodiversity of an area must consider
                                                                           both species richness and species evenness. Consider the
                    When we want to understand the diversity of species in an   two forest communities, Community 1 and Community 2,
                    area and how this diversity differs among locations due to   shown in FIGURE 8.6. Both forests contain 20 trees that are
                             A
                         B


                       C


                         D


                                       Community 1                                         Community 2
                              A: 25%     B: 25%     C: 25%     D: 25%             A: 70%     B: 10%     C: 10%     D: 10%
                    FIGURE 8.6  Measures of species diversity.  Species richness and species evenness are two
                    different measures of species diversity. Although both communities contain the same number of
                    species, Community 1 has a more even distribution of species and is therefore more diverse than
                    Community 2. Percentages of the four tree species are provided below each community.


                    102   UNIT 2    ■  The Living World: Biodiversity
                                                   Uncorrected proofs have been used in this sample.
                                                   Copyright © Bedford, Freeman & Worth Publishers.
                                        Distributed by Bedford, Freeman & Worth Publishers. Not for redistribution.

          03_FriedlandRelyea4e_40928_Unit 2_094_171_6pp.indd   102                                                              16/08/22   2:36 PM