
Page 31 - Demo
P. 31
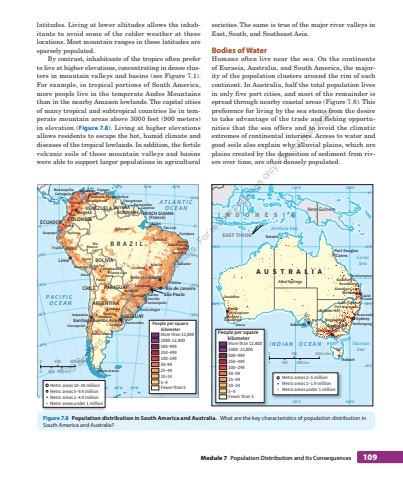
Module 7 Population Distribution and Its%u00a0Consequences 109societies. The same is true of the major river valleys in East, South, and Southeast Asia. Bodies of Water Humans often live near the sea. On the continents of Eurasia, Australia, and South America, the majority of the population clusters around the rim of each continent. In Australia, half the total population lives in only five port cities, and most of the remainder is spread through nearby coastal areas ( Figure 7.8 ). This preference for living by the sea stems from the desire to take advantage of the trade and fishing opportunities that the sea offers and to avoid the climatic extremes of continental interiors. Access to water and good soils also explain why alluvial plains, which are plains created by the deposition of sediment from rivers over time, are often densely populated. latitudes. Living at lower altitudes allows the inhabitants to avoid some of the colder weather at these locations. Most mountain ranges in these latitudes are sparsely populated. By contrast, inhabitants of the tropics often prefer to live at higher elevations, concentrating in dense clusters in mountain valleys and basins (see Figure 7.1 ). For example, in tropical portions of South America, more people live in the temperate Andes Mountains than in the nearby Amazon lowlands. The capital cities of many tropical and subtropical countries lie in temperate mountain areas above 3000 feet (900 meters) in elevation ( Figure 7.8 ). Living at higher elevations allows residents to escape the hot, humid climate and diseases of the tropical lowlands. In addition, the fertile volcanic soils of these mountain valleys and basins were able to support larger populations in agricultural ATLANTICOCEANPACIFIC OCEAN90%u00b0W60%u00b0W 50%u00b0W50%u00b0W 30%u00b0W 20%u00b0W40%u00b0W70%u00b0W 60%u00b0W0%u00b00%u00b010%u00b0N10%u00b0S20%u00b0S30%u00b0S10%u00b0S20%u00b0S30%u00b0S40%u00b0SCOLOMBIAVENEZUELA GUYANASURINAME FRENCH GUIANA(France)BRAZILECUADORPERUBOLIVIAPARAGUAYURUGUAYCHILEARGENTINAS%u00e3o PauloBuenos AiresRio de JaneiroLimaBogot%u00e1SantiagoBelo HorizonteCaliBel%u00e9mRecifeCaracasGeorgetown Paramaribo CayenneGoi%u00e2niaMedell%u00ednBras%u00edlia SalvadorCampinasAsunci%u00f3nCuritibaMaracaiboGuayaquil FortalezaPorto AlegreManausSanta CruzNatalMacei%u00f3La Paz CochabambaC%u00f3rdobaMendoza RosarioJo%u00e3o PessoaBarranquillaFlorian%u00f3polisVit%u00f3ria S%u00e3o Lu%u00edsJoinvilleValenciaMontevideoBarquisimetoSantosCartagenaQuitoArequipaTeresinaLa PlataValpara%u00edsoConcepci%u00f3nBah%u00eda BlancaPunta ArenasSucrePotos%u00edCuscoAricaTrujilloIquitosCiudad Bol%u00edvarRio Branco0 400 800 miles0 400 800 km90%u00b0W 70%u00b0W Metro areas 10%u201320 millionMetro areas 5%u20139.9 millionMetro areas 1%u20134.9 millionMetro areas under 1 million30%u00b0W 20%u00b0WMore than 12,8001000%u201312,800500%u2013999250%u2013499100%u201324950%u20139925%u20134910%u2013245%u20139Fewer than 5People per square kilometerBass StraitTasmanSeaCoralSeaArafura SeaAUSTRALIAINDONESIAEAST TIMORINDIAN OCEANNew Guinea150%u00b0E150%u00b0E135%u00b0E135%u00b0E120%u00b0E0%u00b015%u00b0S 15%u00b0S30%u00b0S 30%u00b0S45%u00b0S120%u00b0ESydneyMelbournePerthBrisbaneAdelaideDarwinBroken HillAlice SpringsCairnsPort DouglasHobartCanberraWagga Wagga WollongongGeraldtonBunburyRockinghamBusseltonAlbanyGoldCoastNewcastlePort MacquarieCoffs HarbourSunshine CoastBundabergGladstoneRockhampton0 500 1000 miles0 500 1000 km120%u00b0E120%u00b0E00More than 12,8001000%u201312,800500%u2013999250%u2013499100%u201324950%u20139925%u20134910%u2013245%u20139Fewer than 5People per square kilometerMetro areas 2%u20135 millionMetro areas 1%u20131.9 millionMetro areas under 1 millionFigure 7.8 Population distribution in South America and Australia. What are the key characteristics of population distribution in South America and Australia? %u00a9 Bedford, Freeman & Worth Publishers. For review purposes only. Do not distribute.
