Page 34 - bfw-APHG-1e
P. 34

80°N                                                          80°N
                                                                     Arctic Circle
                                                                     Arctic Circle
                                  60°N                                                                            60°N

                            40°N                                                                                        40°N
                                                          ATLANTIC
                                                           OCEAN                                                   Tropic of Cancer
                                                                                                                   Tropic of Cancer
                         20°N                                                                                              20°N
                                PACIFIC                                                                        PACIFIC
                                 OCEAN                                                                          OCEAN
                                                                                                                     Equator
                          0°                                                                                         Equator  0°
                                                                                          INDIAN
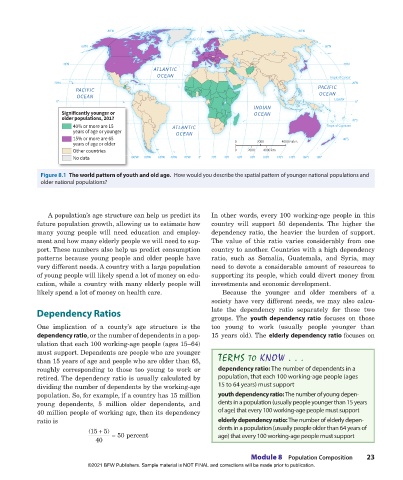
                            Significantly younger or                                       OCEAN
                            older populations, 2017                                                                        20°S
                               40% or more are 15               ATLANTIC                                          Tropic of Capricorn
                                                                                                                  Tropic of Capricorn
                               years of age or younger           OCEAN
                            40°S 15% or more are 65                                                                     40°S
                            40°S
                            40°S
                               years of age or older                                0      2000     4000 miles
                               Other countries                                      0   2000  4000 km
                               No data  160°W  140°W  120°W  100°W  80°W  60°W  40°W  20°W  0°  20°E  40°E  60°E  80°E  100°E  120°E  140°E  160°E  180°
                                              120°W
                                          140°W
                                     160°W
                     Figure 8.1  The world pattern of youth and old age.  How would you describe the spatial pattern of younger national populations and
                     older national populations?


                       A population’s age structure can help us predict its   In other words, every 100 working-age people in this
                    future population growth, allowing us to estimate how    country will support 50 dependents.  The higher the
                    many  young people will need  education  and employ-     dependency ratio, the heavier the burden of support.
                    ment and how many elderly people we will need to sup-    The value of this ratio varies considerably from one
                    port. These numbers also help us predict consumption     country to another. Countries with a high dependency
                    patterns because young people and older people have      ratio, such as Somalia, Guatemala, and Syria, may
                    very different needs. A country with a large population   need to devote a considerable amount of resources to
                    of young people will likely spend a lot of money on edu-  supporting its people, which could divert money from
                    cation, while a country with many elderly people will    investments and economic development.
                    likely spend a lot of money on health care.                 Because the younger and older members of a
                                                                             society have very different needs, we may also calcu-
                    Dependency Ratios                                        late the dependency ratio separately for these two
                                                                             groups. The  youth  dependency  ratio focuses on those
                    One  implication  of  a  county’s  age  structure  is  the   too  young  to work  (usually  people younger than
                    dependency ratio, or the number of dependents in a pop-  15 years old). The elderly dependency ratio focuses on
                    ulation that each 100 working-age people (ages 15–64)
                    must support. Dependents are people who are  younger
                    than 15 years of age and people who are older than 65,     TERMS TO KNOW . . .
                    roughly corresponding to those too young to work or        dependency ratio: The number of dependents in a
                      retired. The dependency ratio is usually calculated by   population, that each 100 working-age people (ages
                    dividing the number of dependents by the working-age       15 to 64 years) must support
                      population. So, for example, if a country has 15 million   youth dependency ratio: The number of young depen-
                    young dependents, 5  million older dependents, and         dents in a population (usually people younger than 15 years
                    40 million people of working age, then its dependency      of age) that every 100 working-age people must support
                    ratio is                                                   elderly dependency ratio: The number of elderly depen-
                                    (15 + 5)  = 50 percent                     dents in a population (usually people older than 64 years of
                                       40                                      age) that every 100 working-age people must support


                                                                                          Module 8  Population Composition     23
                                    ©2021 BFW Publishers. Sample material is NOT FINAL and corrections will be made prior to publication.


          02_Hildebrhgap1e_19224_unit02_002_131_4pp.indd   23                                                                   05/19/20   6:03 PM
   29   30   31   32   33   34   35   36   37   38   39