Page 32 - bfw-APHG-1e
P. 32

Free Response Questions

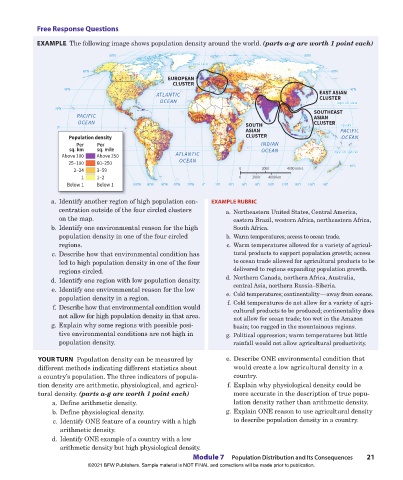
                    EXAMPLE  The following image shows population  density around the world. (parts a-g are worth 1 point each)

                                           80°N                                                            80°N
                                                                       Arctic Circle
                                                                       Arctic Circle
                                   60°N                                                                             60°N
                                                              EUROPEAN
                                                                CLUSTER
                            40°N                                                                                          40°N
                                                           ATLANTIC                                             EAST ASIAN
                                                                                                                CLUSTER
                                                            OCEAN                                                    Tropic of Cancer
                                                                                                                     Tropic of Cancer
                          20°N                                                                                SOUTHEAST      20°N
                                 PACIFIC                                                                      ASIAN
                                 OCEAN                                                  SOUTH                 CLUSTER
                                                                                                                       Equator
                          0°                                                                                           Equator  0°
                                                                                        ASIAN                          PACIFIC
                              Population density                                        CLUSTER                        OCEAN
                                Per    Per                                                   INDIAN                          20°S
                              sq. km   sq. mile                                              OCEAN                  Tropic of Capricorn
                                                                                                                    Tropic of Capricorn
                            Above 100  Above 250                 ATLANTIC
                              25–100   60–250                     OCEAN
                             40°S                                                                                         40°S
                             40°S
                             40°S
                                2–24   3–59                                           0      2000    4000 miles
                                  1    1–2                                            0   2000  4000 km
                             Below 1  160°W Below 1  100°W  80°W  60°W  40°W  20°W  0°  20°E  40°E  60°E  80°E  100°E  120°E  140°E  160°E  180°
                                      160°W
                         a. Identify another region of high population con-  EXAMPLE RUBRIC
                           centration outside of the four circled clusters        a.  Northeastern United States, Central America,
                           on the map.                                              eastern Brazil, western Africa, northeastern Africa,
                         b. Identify one environmental reason for the high          South Africa.
                           population density in one of the four circled          b.  Warm temperatures; access to ocean trade.
                           regions.                                               c.  Warm temperatures allowed for a variety of agricul-
                         c. Describe how that environmental condition has           tural products to support population growth; access
                           led to high population density in one of the four        to ocean trade allowed for agricultural products to be
                           regions circled.                                         delivered to regions expanding population growth.
                         d. Identify one region with low population density.      d.  Northern Canada, northern Africa, Australia,
                                                                                      central Asia, northern Russia–Siberia.
                         e. Identify one environmental reason for the low         e.  Cold temperatures; continentality — away from oceans.
                           population density in a region.                        f.  Cold temperatures do not allow for a variety of agri-
                         f. Describe how that environmental condition would         cultural products to be produced; continentality does
                           not allow for high population density in that area.      not allow for ocean trade; too wet in the Amazon
                         g. Explain why some regions with possible posi-            basin; too rugged in the mountainous regions.
                           tive environmental conditions are not high in          g.  Political oppression; warm temperatures but little
                           population density.                                      rainfall would not allow agricultural  productivity.


                    YOUR TURN  Population density can be measured by             e. Describe ONE environmental condition that
                    different  methods indicating different statistics about        would create a low agricultural density in a
                    a country’s population. The three indicators of popula-         country.
                    tion density are arithmetic, physiological, and agricul-     f. Explain why physiological density could be
                    tural density. (parts a-g are worth 1 point each)               more accurate in the description of true popu-
                        a. Define arithmetic density.                               lation density rather than arithmetic density.
                        b. Define physiological density.                          g. Explain ONE reason to use agricultural  density
                        c. Identify ONE feature of a country with a high            to describe population density in a country.
                           arithmetic density.
                        d. Identify ONE example of a country with a low
                           arithmetic density but high physiological density.
                                                                       Module 7   Population Distribution and Its  Consequences  21
                                    ©2021 BFW Publishers. Sample material is NOT FINAL and corrections will be made prior to publication.


          02_Hildebrhgap1e_19224_unit02_002_131_4pp.indd   21                                                                   05/19/20   6:03 PM
   27   28   29   30   31   32   33   34   35   36   37