
Page 42 - bfw-APHG-1e
P. 42
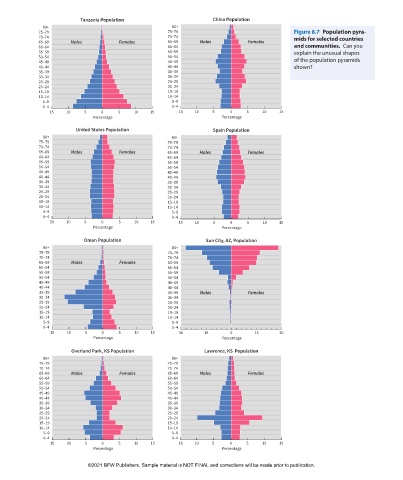
Tanzania Population                        China Population
                     80+                                        80+
                    75–79                                     75–79                                     Figure 8.7   Population pyra-
                    70–74                                     70–74                                     mids for  selected countries
                    65–69      Males          Females         65–69      Males           Females
                    60–64                                     60–64                                     and  communities.  Can you
                    55–59                                     55–59                                     explain the unusual shapes
                    50–54                                     50–54                                     of the population pyramids
                    45–49                                     45–49
                    40–44                                     40–44                                     shown?
                    35–39                                     35–39
                    30–34                                     30–34
                    25–29                                     25–29
                    20–24                                     20–24
                    15–19                                     15–19
                    10–14                                     10–14
                      5–9                                       5–9
                      0–4                                       0–4
                        15   10    5     0    5    10    15       15   10    5     0    5    10    15
                                      Percentage                                Percentage
                                United States Population                     Spain Population
                      80+                                       80+
                    75–79                                     75–79
                    70–74                                     70–74
                    65–69      Males          Females         65–69      Males           Females
                    60–64                                     60–64
                    55–59                                     55–59
                    50–54                                     50–54
                    45–49                                     45–49
                    40–44                                     40–44
                    35–39                                     35–39
                    30–34                                     30–34
                    25–29                                     25–29
                    20–24                                     20–24
                    15–19                                     15–19
                    10–14                                     10–14
                      5–9                                       5–9
                      0–4                                       0–4
                        15   10    5     0    5    10    15       15   10    5     0    5    10    15
                                      Percentage                                Percentage
                                   Oman Population                         Sun City, AZ, Population
                      80+                                       80+
                    75–79                                     75–79
                    70–74                                     70–74
                    65–69      Males           Females        65–69
                    60–64                                     60–64
                    55–59                                     55–59
                    50–54                                     50–54
                    45–49                                     45–49
                    40–44                                     40–44
                    35–39                                     35–39      Males           Females
                    30–34                                     30–34
                    25–29                                     25–29
                    20–24                                     20–24
                    15–19                                     15–19
                    10–14                                     10–14
                      5–9                                       5–9
                      0–4                                       0–4
                        15   10    5     0    5    10    15       30      15       0       15      30
                                      Percentage                                Percentage

                               Overland Park, KS Population               Lawrence, KS  Population
                      80+                                       80+
                    75–79                                     75–79
                    70–74                                     70–74
                    65–69      Males           Females        65–69      Males           Females
                    60–64                                     60–64
                    55–59                                     55–59
                    50–54                                     50–54
                    45–49                                     45–49
                    40–44                                     40–44
                    35–39                                     35–39
                    30–34                                     30–34
                    25–29                                     25–29
                    20–24                                     20–24
                    15–19                                     15–19
                    10–14                                     10–14
                      5–9                                       5–9
                      0–4                                       0–4
                        15   10    5     0    5    10    15       15   10    5     0    5    10    15
                                      Percentage                                Percentage

                                    ©2021 BFW Publishers. Sample material is NOT FINAL and corrections will be made prior to publication.


          02_Hildebrhgap1e_19224_unit02_002_131_4pp.indd   31                                                                   05/19/20   6:04 PM