Page 44 - bfw-APHG-1e
P. 44

Module 8 Review


                         8-1   Ho w do w e describe the age struc tur         •  Understanding the characteristics of different social
                         8-1  How do we describe the age structure e
                              of a population?                                  generations helps us predict economic and social
                              of a population?
                                                                                trends.
                     •  Age structure refers to the shares of various age
                       groups in the total population. We may use five-year       8-3
                                                                                  8-3
                                                                                        What is the sex ratio of a population?
                       groupings  or  three  large  groups:  pre-reproductive,          W ha t is the se x r a tio of a popula tion?
                       reproductive, and post-reproductive.                   •  Sex ratio is the numerical ratio of males to females
                     •  Age structure affects future population growth, labor   in the population.
                       supply, dependency ratios, demand for services, and    •  Unbalanced sex ratios may be caused by cultural
                       economic growth.                                         preferences for males, gender-selective migration,
                     •  The dependency ratio is the number of dependents        and war. They can have serious social consequences.
                       per 100 working-age people.
                     •  The youth dependency ratio is the number of young
                                                                                  8-4
                                                                                          What can a population pyramid be
                       dependents (under age 15) per 100 working-age              8-4     W ha t can a popula tion p yr amid be
                                                                                        used for?
                       people. The elderly dependency ratio is the number               used for?
                       of elderly dependents (ages 65 and older) per 100      •  A population pyramid illustrates the age-sex struc-
                       working-age individuals.
                                                                                ture of a population based on five-year age  groupings.
                         8-2  What are the major social generations in tions in
                         8-2   W ha t ar e the major social gener a           •  The shape of a country’s or a place’s population pyr-
                              the United States?
                              the United States?                                amid can speak volumes about its past demographic
                                                                                changes and its future.
                     •  Generations are groups of people born around the same
                       time who share common cultural traits and values.


                    AP® Exam Practice Questions                                                         Preparing for the  AP® Exam


                    Multiple-Choice Questions                                     a. A decrease in the working-age population
                                                                                  b. The demographic effects of World War II
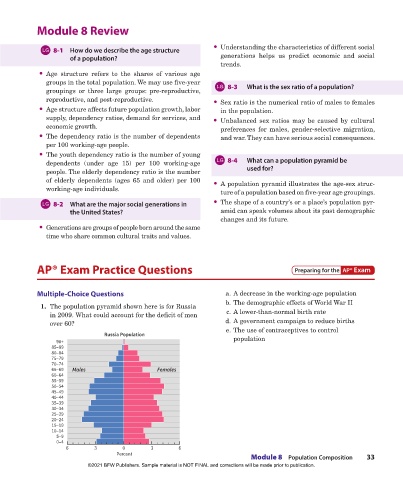
                     1.  The population pyramid shown here is for Russia
                        in 2009. What could account for the deficit of men        c. A lower-than-normal birth rate
                        over 60?                                                  d. A government campaign to reduce births
                                                                                  e. The use of contraceptives to control
                                          Russia Population
                          90+                                                       population 
                        85–89
                        80–84
                        75–79
                        70–74
                        65–69  Males                       Females
                        60–64
                        55–59
                        50–54
                        45–49
                        40–44
                        35–39
                        30–34
                        25–29
                        20–24
                        15–19
                        10–14
                          5–9
                          0–4
                             6        3         0        3        6
                                              Percent
                                                                                          Module 8  Population Composition     33
                                    ©2021 BFW Publishers. Sample material is NOT FINAL and corrections will be made prior to publication.


          02_Hildebrhgap1e_19224_unit02_002_131_4pp.indd   33                                                                   05/19/20   6:04 PM
   39   40   41   42   43   44   45   46   47   48   49