
Page 34 - 2023-bfw-APES-4e-new.indd
P. 34
UNIT 2
Practice Your Science Skills
Preparing for the AP Exam
®
Data Analysis
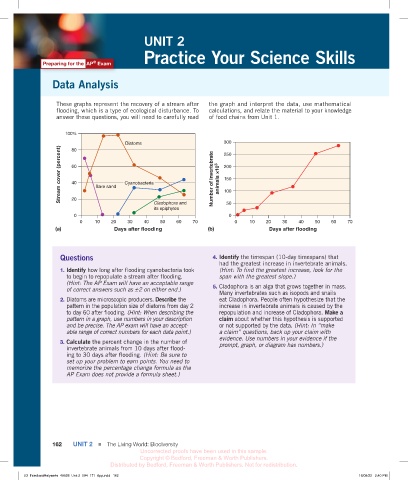
These graphs represent the recovery of a stream after the graph and interpret the data, use mathematical
flooding, which is a type of ecological disturbance. To calculations, and relate the material to your knowledge
answer these questions, you will need to carefully read of food chains from Unit 1.
100%
Diatoms 300
Stream cover (percent) 60 Bare sand Cyanobacteria Number of invertebrate animals ×10 3 200
80
250
150
40
100
20
Cladophora and
its epiphytes 50
0 0
0 10 20 30 40 50 60 70 0 10 20 30 40 50 60 70
(a) Days after flooding (b) Days after flooding
Questions 4. Identify the timespan (10-day timespans) that
had the greatest increase in invertebrate animals.
1. Identify how long after flooding cyanobacteria took (Hint: To find the greatest increase, look for the
to begin to repopulate a stream after flooding. span with the greatest slope.)
(Hint: The AP Exam will have an acceptable range 5. Cladophora is an alga that grows together in mass.
of correct answers such as ± 2 on either end.)
Many invertebrates such as isopods and snails
2. Diatoms are microscopic producers. Describe the eat Cladophora. People often hypothesize that the
pattern in the population size of diatoms from day 2 increase in invertebrate animals is caused by the
to day 60 after flooding. (Hint: When describing the repopulation and increase of Cladophora. Make a
pattern in a graph, use numbers in your description claim about whether this hypothesis is supported
and be precise. The AP exam will have an accept- or not supported by the data. (Hint: In “make
able range of correct numbers for each data point.) a claim” questions, back up your claim with
evidence. Use numbers in your evidence if the
3. Calculate the percent change in the number of prompt, graph, or diagram has numbers.)
invertebrate animals from 10 days after flood-
ing to 30 days after flooding. (Hint: Be sure to
set up your problem to earn points. You need to
memorize the percentage change formula as the
AP Exam does not provide a formula sheet.)
162 UNIT 2 ■ The Living World: Biodiversity
Uncorrected proofs have been used in this sample.
Copyright © Bedford, Freeman & Worth Publishers.
Distributed by Bedford, Freeman & Worth Publishers. Not for redistribution.
03_FriedlandRelyea4e_40928_Unit 2_094_171_6pp.indd 162 16/08/22 2:40 PM