
Page 65 - Demo
P. 65
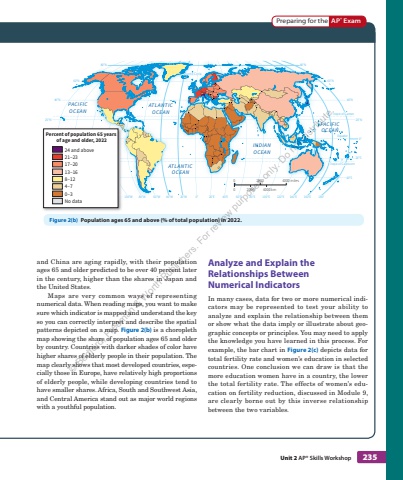
Unit 2 AP%u00ae Skills Workshop 235and China are aging rapidly, with their population ages 65 and older predicted to be over 40 percent later in the century, higher than the shares in Japan and the United States. Maps are very common ways of representing numerical data. When reading maps, you want to make sure which indicator is mapped and understand the key so you can correctly interpret and describe the spatial patterns depicted on a map. Figure 2(b) is a choropleth map showing the share of population ages 65 and older by country. Countries with darker shades of color have higher shares of elderly people in their population. The map clearly shows that most developed countries, especially those in Europe, have relatively high proportions of elderly people, while developing countries tend to have smaller shares. Africa, South and Southwest Asia, and Central America stand out as major world regions with a youthful population. Analyze and Explain the Relationships Between Numerical%u00a0Indicators In many cases, data for two or more numerical indicators may be represented to test your ability to analyze and explain the relationship between them or show what the data imply or illustrate about geographic concepts or principles. You may need to apply the knowledge you have learned in this process. For example, the bar chart in Figure 2(c) depicts data for total fertility rate and women%u2019s education in selected countries. One conclusion we can draw is that the more education women have in a country, the lower the total fertility rate. The effects of women%u2019s education on fertility reduction, discussed in Module 9, are clearly borne out by this inverse relationship between the two variables. Preparing for the AP%u00ae ExamTropic of CancerArctic CircleTropic of CapricornEquatorPACIFICOCEANPACIFICOCEANATLANTICOCEANATLANTICOCEANINDIANOCEAN20%u00b0N20%u00b0S40%u00b0S40%u00b0N60%u00b0N80%u00b0N0%u00b020%u00b0N20%u00b0S40%u00b0S40%u00b0N60%u00b0N80%u00b0N0%u00b0160%u00b0W 100%u00b0W 80%u00b0W 60%u00b0W 40%u00b0W 20%u00b0W 0%u00b0 20%u00b0E 40%u00b0E 60%u00b0E 80%u00b0E 100%u00b0E 120%u00b0E 140%u00b0E 160%u00b0E 180%u00b0Tropic of CancerArctic CircleTropic of CapricornEquator0 2000 4000 miles0 2000 4000 km20%u00b0S40%u00b0S0%u00b0160%u00b0WPercent of population 65 years of age and older, 202224 and above21%u20132317%u20132013%u2013168%u2013124%u201370%u20133No data Figure 2(b) Population ages 65 and above (% of total population) in 2022. %u00a9 Bedford, Freeman & Worth Publishers. For review purposes only. Do not distribute.
