
Page 66 - Demo
P. 66
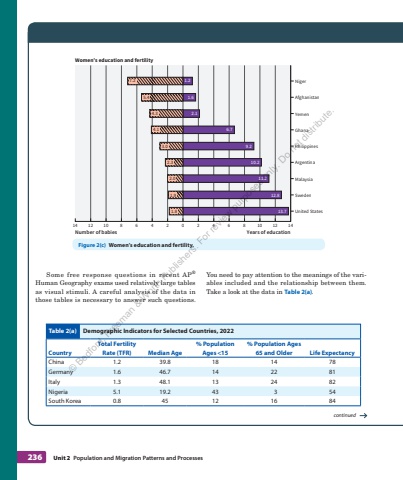
236 Unit 2 Population and Migration%u00a0Patterns and%u00a0ProcessesSome free response questions in recent AP%u00aeHuman Geography exams used relatively large tables as visual stimuli. A careful analysis of the data in those tables is necessary to answer such questions. You need to pay attention to the meanings of the variables included and the relationship between them. Take a look at the data in Table 2(a).Table 2(a) Demographic Indicators for Selected Countries, 2022CountryTotal Fertility Rate (TFR) Median Age% Population Ages <15 % Population Ages 65 and Older Life ExpectancyChina 1.2 39.8 18 14 78Germany 1.6 46.7 14 22 81Italy 1.3 48.1 13 24 82Nigeria 5.1 19.2 43 3 54South Korea 0.8 45 12 16 8413.712.811.210.29.26.72.11.61.214 12 10 8 6 4 2 0 2 4 6 8 10 12 14United StatesSwedenMalaysiaArgentinaPhilippinesGhanaYemenAfghanistanNigerNumber of babiesWomen%u2019s education and fertilityYears of education1.81.92.02.33.04.14.35.47.2Figure 2(c) Women%u2019s education and fertility.continued%u00a9 Bedford, Freeman & Worth Publishers. For review purposes only. Do not distribute.
