
Page 2 - Demo
P. 2
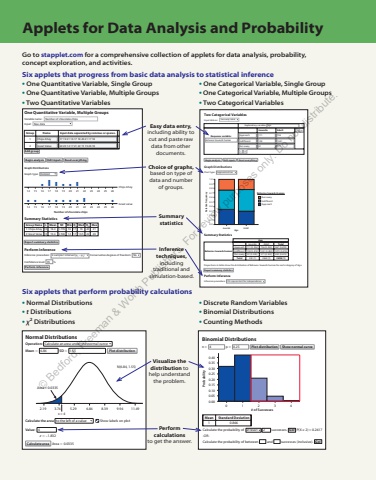
Applets for Data Analysis and ProbabilityGo to stapplet.com for a comprehensive collection of applets for data analysis, probability, concept exploration, and activities. One Quantitative Variable, Multiple GroupsGroup I Name nput data separated by commas or spaces.Variable name: Number of chocolate chipsInput:1 Chips Ahoy 17 19 21 16 17 18 20 21 17 182 Great ValueAdd group22 20 14 17 21 22 15 19 26 18Raw dataBegin analysisPerform inferenceEdit inputs Reset everythingGraph DistributionsGraph type: DotplotPerform InferenceInference procedure: 2-sample t interval (%u00b51 %u2013 %u00b52) Conservative degrees of freedom: NoConfidence level: 95 %Summary StatisticsGroup Name n Mean SD Min M Q ed Max 1 Q31: Chips Ahoy 10 18.4 1.776 16 18 21 17 202: Great Value 10 19.4 3.596 14 19. 17 22 5 26Number of chocolate chips14 15 16 17 18 19 20 21 22 24 26Great value23 25d d d dd d d dd d14 15 16 17 18 19 20 21 22 24 26Chips Ahoy23 25d dddd d d d ddExport summary statisticsTwo Categorical VariablesInput data as: Two-way tableBegin analysis Edit inputs Reset everythingGraph DistributionsChart type: Segmented barPerform InferenceProportions in table show the distribution of Behavior towards human for each category of Age.Inference procedure: Chi-square test for independenceBehavior towards humanJuvenileResponse variable:Adult111 756138 1241%u2013ApproachIndifferent Behavior towards humanExplanatory variable: AgeRun away 81 571+%u2013 +Summary StatisticsBehavior towards humanTotalAgeAdult756 (0.294) 867 (0.299)JuvenileApproach 111 (0.336)IndifferentRun awayTotal138 (0.418)81 (0.245)330 (1)1241 (0.483)571 (0.222) 652 (0.225)2568 (1) 2898 (1)1379 (0.476)Run awayIndifferentApproach0.91.00.20.30.40.50.60.70.80.10.0Relative frequencyAge Juvenile AdultExport summary statisticsEasy data entry, including ability to cut and paste raw data from other documents.Visualize the distribution to help understand the problem.Perform calculations to get the answer.Inference techniques, including traditional and simulation-based.Choice of graphs, based on type of data and number of groups.Summary statisticsSix applets that progress from basic data analysis to statistical inference%u2022 One Quantitative Variable, Single Group %u2022 One Categorical Variable, Single Group%u2022 One Quantitative Variable, Multiple Groups %u2022 One Categorical Variable, Multiple Groups%u2022 Two Quantitative Variables %u2022 Two Categorical Variables2.19 3.74x = 45.29 6.84 8.39 9.94 11.49Mean 5 6.84 SD 5 1.55 Plot distributionN(6.84, 1.55)Normal DistributionsOperation: Calculate an area under the normal curveCalculate the area to the left of a value Show labels on plot4z 5 %u20131.832Value:Calculate area Area 5 0.0335Area = 0.03351 0.866Mean Standard DeviationCalculate the probability of-ORCalculate the probability of between and successesat least 2 successes. P(X %u2265 2) = 0.2617 Go!Binomial Distributionsn = 4 p = 0.25 Plot distribution Show normal curve(inclusive). Go!# of Successes0.000 2 1 3 40.050.100.150.200.250.300.350.40ProbabilitySix applets that perform probability calculations%u2022 Normal Distributions %u2022 Discrete Random Variables%u2022 t Distributions %u2022 Binomial Distributions%u2022 %u03c72 Distributions %u2022 Counting Methods%u00a9 Bedford, Freeman & Worth Publishers. For review purposes only. Do not distribute.
