
Page 5 - Demo
P. 5
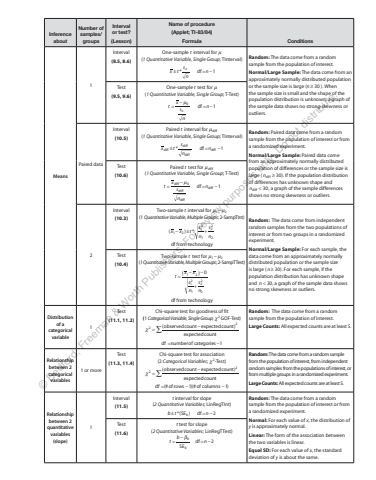
Inference aboutNumber of samples/groupsInterval or test?(Lesson)Name of procedure(Applet; TI-83/84)Formula ConditionsMeans1Interval(8.5, 8.6)One-sample t interval for %u00b5(1 Quantitative Variable, Single Group; TInterval)x t %u00b1 = * df 1%u2212 sn n xRandom: The data come from a random sample from the population of interest.Normal/Large Sample: The data come from an approximately normally distributed population or the sample size is large (n %u2265 30 ). When the sample size is small and the shape of the population distribution is unknown, a graph of the sample data shows no strong skewness or outliers.Test(9.5, 9.6)One-sample t test for %u00b5(1 Quantitative Variable, Single Group; T-Test)%u00b5 = %u2212 df = %u22121 0 t xsnn xPaired dataInterval(10.5)Paired t interval for %u00b5diff(1 Quantitative Variable, Single Group; TInterval)diff %u00b1 = * df 1%u2212 diffdiffx t diffsn nRandom: Paired data come from a random sample from the population of interest or from a randomized experiment.Normal/Large Sample: Paired data come from an approximately normally distributed population of differences or the sample size is large ( ndiff %u2265 30). If the population distribution of differences has unknown shape and ndiff < 30, a graph of the sample differences shows no strong skewness or outliers.Test(10.6)Paired t test for %u00b5diff(1 Quantitative Variable, Single Group; T-Test)%u00b5 = %u2212 df = %u22121 diff 0diffdiffdiff t xsnn2Interval(10.3)Two-sample t interval for %u00b5 %u00b5 1 2 %u2212(1 Quantitative Variable, Multiple Groups; 2-SampTInt)( ) 1 2 %u2212 %u00b1 * + 121222x x t snsndf from technologyRandom: The data come from independent random samples from the two populations of interest or from two groups in a randomized experiment.Normal/Large Sample: For each sample, the data come from an approximately normally distributed population or the sample size is large ( n%u2265 30). For each sample, if the population distribution has unknown shape and n < 30, a graph of the sample data shows no strong skewness or outliers.Test(10.4)Two-sample t test for %u00b5 %u00b5 1 2 %u2212(1 Quantitative Variable, Multiple Groups; 2-SampTTest)( ) = %u2212 %u2212+1 2 0121222t x xsnsndf from technologyDistribution of a categorical variable1Test(11.1, 11.2)Chi-square test for goodness of fit(1 Categorical Variable, Single Group; 2 %u03c7 GOF-Test)%u03c7 =%u2211 %u2212= %u2212(observedcount expectedcount)expectedcountdf numberof categories 122Random: The data come from a random sample from the population of interest.Large Counts: All expected counts are at least 5.Relationship between 2 categorical variables1 or moreTest(11.3, 11.4)Chi-square test for association(2 Categorical Variables; 2 %u03c7 -Test)%u03c7 =%u2211 %u2212= %u2212 %u2212(observedcount expectedcount)expectedcountdf (#ofrows 1)(#of columns 1)22Random: The data come from a random sample from the population of interest, from independent random samples from the populations of interest, or from multiple groups in a randomized experiment.Large Counts: All expected counts are at least 5.Relationship between 2 quantitative variables (slope)1Interval(11.5)t interval for slope(2 Quantitative Variables; LinRegTInt)b t %u00b1 = *(SEb ) df 2 n %u2212Random: The data come from a random sample from the population of interest or from a randomized experiment.Normal: For each value of x, the distribution of y is approximately normal.Linear: The form of the association between the two variables is linear.Equal SD: For each value of x, the standard deviation of y is about the same.Test(11.6)t test for slope(2 Quantitative Variables; LinRegTTest)SEdf 2 %u03b20 = %u2212 t = %u2212 b nb%u00a9 Bedford, Freeman & Worth Publishers. For review purposes only. Do not distribute.
