
Page 32 - Demo
P. 32
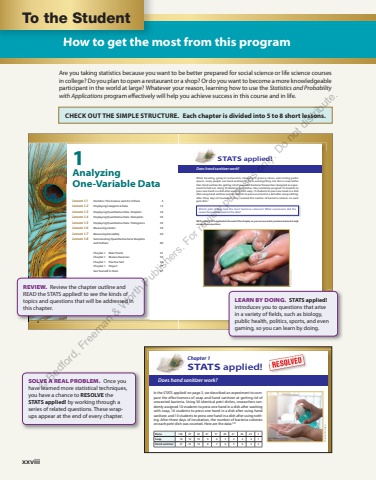
xxviii Are you taking statistics because you want to be better prepared for social science or life science courses in college? Do you plan to open a restaurant or a shop? Or do you want to become a more knowledgeable participant in the world at large? Whatever your reason, learning how to use the Statistics and Probability with Applications program effectively will help you achieve success in this course and in life. CHECK OUT THE SIMPLE STRUCTURE. Each chapter is divided into 5 to 8 short lessons. How to get the most from this program To the Student xxviii90 Chapter 1 %u2022 Analyzing One-Variable DataElectoral votes0 5 10 15 20 25 30 35 40 45 50 55n Mean SD Minimum Q1 Median Q3 Maximum 51 10.549 9.653 3 4 8 12 54 (a) One simple formula for calculating skewness is maximum medianmedian minimum%u2212%u2212 . Compute this value for the electoral vote data. Explain why this formula should yield a value greater than 1 for a rightskewed distribution. (b) Choosing only from the summary statistics provided, define a formula for a different statistic that measures skewness. Compute the value of this statistic for the electoral vote data. What values of this statistic might indicate that a distribution is skewed to the right? Explain your reasoning. Recycle and Review 24. Best in show (1.2) Here is a frequency table showing the breed group of the dog that won Best in Show at the Westminster Kennel Club dog show for 96 years. 113 Make a relative frequency bar chart for these data. Describe what you see. Breed group Frequency Breed group Frequency Terrier 38 Toy 11 Sporting 18 Non-sporting 9 Working 15 Hound 5 25. Hurricanes (1.5, 1.6) The histogram shows the distribution of the number of Atlantic hurricanes per year for more than 150 years. 114 2051015202530354 6 8 10 12 14 16Number of hurricanesFrequency (a) Describe the shape of the distribution. (b) Which would be a better measure of the typical number of hurricanes per year: the mean or the median? Justify your answer. Chapter 1 In the STATS applied! on page 3 , we described an experiment to compare the effectiveness of soap and hand sanitizer at getting rid of unwanted bacteria. Using 30 identical petri dishes, researchers randomly assigned 10 students to press one hand in a dish after washing with soap, 10 students to press one hand in a dish after using hand sanitizer, and 10 students to press one hand in a dish after using nothing. After three days of incubation, the number of bacteria colonies on each petri dish was counted. Here are the data: 115 None 108 97 92 81 57 49 41 38 29 3 Soap 18 10 10 6 6 5 4 4 4 1 Hand sanitizer 27 23 14 8 7 6 5 4 3 2 Kmatta/Getty ImagesSTATS applied! Does hand sanitizer work? 02_StarnesSPA5e_53579_ch01_002_097.indd 90 22/11/24 12:45 PM21 Analyzing One-Variable Data Lesson 1.1 Statistics: The Science and Art of Data 4 Lesson 1.2 Displaying Categorical Data 12 Lesson 1.3 Displaying Quantitative Data: Dotplots 24 Lesson 1.4 Displaying Quantitative Data: Stemplots 35 Lesson 1.5 Displaying Quantitative Data: Histograms 45 Lesson 1.6 Measuring Center 59 Lesson 1.7 Measuring Variability 69 Lesson 1.8 Summarizing Quantitative Data: Boxplots and Outliers 80 Chapter 1 Main Points 91 Chapter 1 Review Exercises 93 Chapter 1 Practice Test 94 Chapter 1 Project 97 See Yourself in Stats 97 02_StarnesSPA5e_53579_ch01_002_097.indd 2 22/11/24 12:37 PM3STATS applied! Does hand sanitizer work? While traveling, going to restaurants, shopping in grocery stores, and visiting public spaces, many people use hand sanitizer to try to avoid getting sick. But is soap better than hand sanitizer for getting rid of unwanted bacteria? Researchers designed an experiment to find out. Using 30 identical petri dishes, they randomly assigned 10 students to press one hand in a dish after washing with soap, 10 students to press one hand in a dish after using hand sanitizer, and 10 students to press one hand in a dish after using nothing. After three days of incubation, they counted the number of bacteria colonies on each petri dish. 1 Which petri dishes had the most bacteria colonies? What conclusion did the researchers make based on the data? We%u2019ll revisit STATS applied! at the end of the chapter, so you can use what you have learned to help answer these questions. Wysiati/iStock/Getty Images02_StarnesSPA5e_53579_ch01_002_097.indd 3 22/11/24 12:37 PM SOLVE A REAL PROBLEM. Once you have learned more statistical techniques, you have a chance to RESOLVE theSTATS applied! by working through a series of related questions. These wrapups appear at the end of every chapter. 3 LEARN BY DOING. STATS applied!introduces you to questions that arise in a variety of fields, such as biology, public health, politics, sports, and even gaming, so you can learn by doing. 2 REVIEW. Review the chapter outline and READ the STATS applied! to see the kinds of topics and questions that will be addressed in this chapter. %u00a9 Bedford, Freeman & Worth Publishers. For review purposes only. Do not distribute.
