
Page 35 - Demo
P. 35
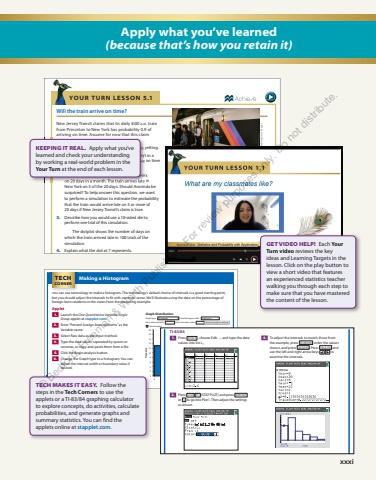
xxxiApply what you%u2019ve learned (because that%u2019s how you retain it) 334 Chapter 5 %u2022 Probability It took our superfan 23 boxes to complete the set of 5 superhero comic books. Does that mean the company lied about how the comic books were distributed? Not necessarily. Our simulation says that it%u2019s unlikely for someone to have to buy 23 boxes or more to get a full set of superhero comic books if each comic book is equally likely to appear in a box of cereal. However, it is still possible that the company was telling the truth and the superfan was just very unlucky. Lesson 5.1 W H AT D I D Y O U L E A R N ? LEARNING TARGET EXAMPLE EXERCISES Interpret probability as a long-run relative frequency. p. 331 5%u20138 Dispel common myths about randomness. p. 331 9%u201312 Use simulation to model chance behavior. p. 333 13%u201316 Will the train arrive on time? New Jersey Transit claims that its daily 8:00 A.M. train from Princeton to New%u00a0York has probability 0.9 of arriving on time. Assume for now that this%u00a0claim is%u00a0true. 1. Explain what probability 0.9 means in this setting. 2. The 8:00 A.M. train has arrived on time 5 days in a row. What%u2019s the%u00a0probability that it will arrive on time tomorrow? Explain your%u00a0answer. Aravinda takes the 8:00 A.M. train to work on 20%u00a0days in a month. The train arrives late in New%u00a0York on 3 of the 20 days. Should Aravinda be surprised? To help answer this question, we want to perform a%u00a0simulation to estimate the probability that the train would arrive late on 3 or more of 20%u00a0days if New%u00a0Jersey Transit%u2019s claim is true. 3. Describe how you would use a 10-sided die to perform one trial of this simulation. The dotplot shows the number of days on which the train arrived late in 100 trials of the simulation. 4. Explain what the dot at 7 represents. 5. Use the results of the simulation to estimate the probability that the train will arrive late on 3 or more of 20 days. 6. Based on the actual result of 3 late arrivals in 20%u00a0days and your answer to Question 5, is there convincing evidence that New Jersey Transit%u2019s claim%u00a0is false? Explain your reasoning. YOUR TURN LESSON 5.1Michael Nagle/Bloomberg/Getty ImagesSimulated number of late arrivals0 1 2 3 4 5 6 706_StarnesSPA5e_53579_ch05_326_405.indd 334 22/11/24 1:45 PM48 Chapter 1 %u2022 Analyzing One-Variable DataMaking a Histogram You can use technology to make a histogram. The technology%u2019s default choice of intervals is a good starting point, but you should adjust the intervals to fit with common sense. We%u2019ll illustrate using the data on the percentage of foreign-born residents in the states from the preceding example. Applet 1. Launch the One Quantitative Variable, Single Group applet at stapplet.com . 2. Enter %u201cPercent foreign-born residents%u201d as the Variable name. 3. Select Raw data as the input method. 4. Type the data values separated by spaces or commas, or copy-and-paste them from a file. 5. Click the Begin analysis button. 6. Change the Graph type to a histogram. You can adjust the interval width or boundary value if desired. Graph DistributionGraph type: Histogram Label histogram with: FrequencyEnter interval width: Enter boundary value:Show boxplot81012141618206420FrequencyPercent foreign-born residents0 5 10 15 20 25 30Reset intervals to default TECHCORNER What are we actually doing when we make a histogram? The dotplot in part (a) shows the foreign-born resident data. We grouped the data values into intervals of width 5, beginning with 0 to <5, as indicated by the dashed lines. Then we counted the number of values in each interval. The dotplot in part (b) shows the results of that process. Finally, we drew bars of the appropriate height for each interval to complete the histogram in part (c). THINK ABOUT IT (a)(b) (c)0 5 10 15 20 25 30Percent foreign-born residentsPercent foreign-born residents0 5 10 15 20 25 3020151050FrequencyPercent foreign-born residents0 5 10 15 20 25 3002_StarnesSPA5e_53579_ch01_002_097.indd 48 22/11/24 12:41 PMLesson 1.5 %u2022 Displaying Quantitative Data: Histograms 49TI-83/841. Press STAT , choose Edit%u2026, and type the data values into list L1.2. Press 2nd Y= (STAT PLOT) and press ENTER or 1 to go into Plot1. Then adjust the settings as%u00a0shown.3. Press ZOOM and choose ZoomStat to let the calculator choose intervals and make a histogram. Press TRACE and use the left and right arrow keys %u25bc%u25bc to examine the calculator%u2019s intervals.4. To adjust the intervals to match those from the example, press WINDOW , enter the values shown, and press GRAPH . Press TRACE and use the left and right arrow keys %u25bc%u25bc to examine the intervals.is%u00a0true. 1. Explain what probability 0.9 means in this setting. 2. The 8:00 A.M. train has arrived on time 5 days in a row. What%u2019s the%u00a0probability that it will arrive on time tomorrow? Explain your%u00a0answer. Aravinda takes the 8:00 A.M. train to work on 20%u00a0days in a month. The train arrives late in KEEPING IT REAL . Apply what you%u2019ve learned and check your understanding by working a real-world problem in the Your Turn at the end of each lesson. 0 TECH MAKES IT EASY. Follow the steps in the Tech Corners to use the applets or a TI-83/84 graphing calculator to explore concepts, do activities, calculate probabilities, and generate graphs and summary statistics. You can find the applets online at stapplet.com. GET VIDEO HELP! Each YourTurn video reviews the key ideas and Learning Targets in the lesson. Click on the play button to view a short video that features an experienced statistics teacher walking you through each step to make sure that you have mastered the content of the lesson. %u00a9 Bedford, Freeman & Worth Publishers. For review purposes only. Do not distribute.
