
Page 27 - bfw-APHG-1e
P. 27
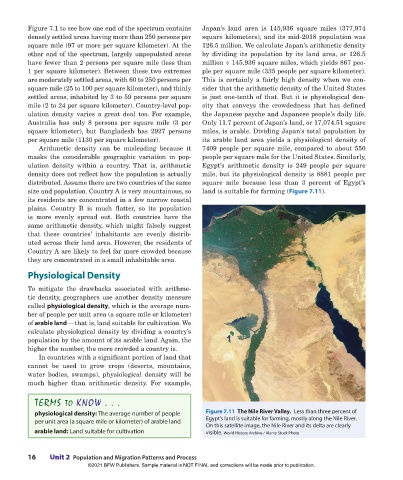
Figure 7.1 to see how one end of the spectrum contains   Japan’s land  area  is 145,936  square miles  (377,974
                 densely settled areas having more than 250 persons per   square kilometers), and its mid-2018 population was
                 square mile (97 or more per square kilometer). At the    126.5 million. We calculate Japan’s arithmetic density
                 other end of the spectrum, largely unpopulated areas     by dividing its population by its land area, or 126.5
                 have fewer than 2 persons per square mile (less than     million ÷ 145,936 square miles, which yields 867 peo-
                 1 per square kilometer). Between these two extremes      ple per square mile (335 people per square kilometer).
                 are moderately settled areas, with 60 to 250 persons per   This is certainly a fairly high density when we con-
                 square mile (25 to 100 per square kilometer), and thinly   sider that the arithmetic density of the United States
                 settled areas, inhabited by 3 to 59 persons per square   is just one-tenth of that. But it is physiological den-
                 mile (2 to 24 per square kilometer). Country-level pop-  sity that conveys the crowdedness that has defined
                 ulation density varies a great deal too. For example,    the Japanese psyche and Japanese people’s daily life.
                 Australia has  only  8   persons  per  square  mile  (3 per   Only 11.7 percent of Japan’s land, or 17,074.51 square
                 square kilometer), but Bangladesh has 2927 persons       miles, is arable. Dividing Japan’s total population by
                 per square mile (1130 per square kilometer).             its arable land area yields a physiological density of
                    Arithmetic density can be misleading because it       7409 people per square mile, compared to about 550
                 masks the considerable geographic variation in pop-      people per square mile for the United States. Similarly,
                 ulation density within a country.  That is, arithmetic   Egypt’s arithmetic density is 249 people per square
                 density does not reflect how the population is actually   mile, but its physiological density is 8881 people per
                 distributed. Assume there are two countries of the same   square mile because less than 3 percent of Egypt’s
                 size and population. Country A is very mountainous, so   land is suitable for farming (Figure 7.11).
                 its residents are concentrated in a few narrow coastal
                 plains. Country B is much flatter, so its population
                 is more evenly spread out. Both countries have the
                 same arithmetic density, which might falsely suggest
                 that  these  countries’  inhabitants  are  evenly  distrib-
                 uted across their land area. However, the residents of
                 Country A are likely to feel far more crowded because
                 they are concentrated in a small inhabitable area.

                 Physiological Density

                 To mitigate the drawbacks associated with arithme-
                 tic density, geographers use another density measure
                 called physiological density, which is the average num-
                 ber of people per unit area (a square mile or kilometer)
                 of arable land — that is, land suitable for cultivation. We
                 calculate physiological density by dividing a country’s
                 population by the amount of its arable land. Again, the
                 higher the number, the more crowded a country is.
                    In countries with a significant portion of land that
                 cannot be used to grow crops (deserts, mountains,
                 water bodies, swamps), physiological density will be
                 much higher than arithmetic density. For   example,

                   TERMS TO KNOW . . .

                   physiological density: The average number of people     Figure 7.11  The Nile River Valley.  Less than three percent of
                   per unit area (a square mile or kilometer) of arable land  Egypt’s land is suitable for farming, mostly along the Nile River.
                                                                           On this satellite image, the Nile River and its delta are clearly
                   arable land: Land suitable for cultivation              visible. World History Archive / Alamy Stock Photo


                 16     Unit 2  Population and Migration Patterns and Process
                                    ©2021 BFW Publishers. Sample material is NOT FINAL and corrections will be made prior to publication.


          02_Hildebrhgap1e_19224_unit02_002_131_4pp.indd   16                                                                   05/19/20   6:03 PM