
Page 62 - bfw-APHG-1e
P. 62
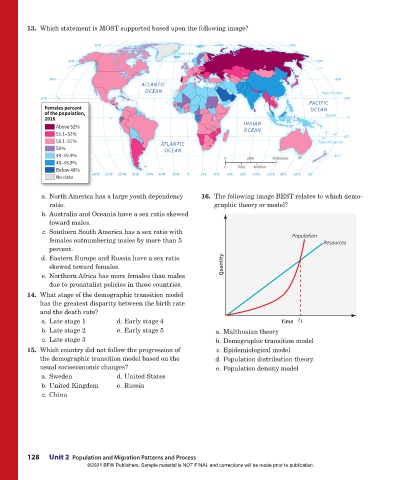
13.  Which statement is MOST supported based upon the following image?


                                       80°N                                                           80°N
                                                                  Arctic Circle
                                                                  Arctic Circle
                              60°N                                                                             60°N

                        40°N                                                                                         40°N
                                                      ATLANTIC
                                                       OCEAN                                                     Tropic of Cancer
                                                                                                                 Tropic of Cancer
                     20°N                                                                                    PACIFIC    20°N
                             A
                              CIFIC
                            PACIFIC
                            P P
                             A
                              CIFIC
                      Females percent                                                                        OCEAN
                            OCEAN
                            OCEAN
                            OCEAN
                      of the population,
                                                                                                                  Equator
                      0° 0° 0° 0° 2016                                                                            Equator  0°
                          Above 52%                                                    INDIAN
                                                                                        OCEAN
                          51.1–52%
                     20°S
                     20°S                                                                                               20°S
                          50.1–51%                          ATLANTIC                                            Tropic of Capricorn
                                                                                                                Tropic of Capricorn
                          50%                                OCEAN
                        40°S49–49.9%                                             0      2000     4000 miles          40°S
                        40°S
                        40°S
                          48–48.9%
                          Below 48%                                              0   2000  4000 km
                                      140°W
                                 160°W  140°W  120°W  100°W  80°W  60°W  40°W  20°W  0°  20°E  40°E  60°E  80°E  100°E  120°E  140°E  160°E  180°
                                 160°W
                          No data
                      a. North America has a large youth dependency        16.  The following image BEST relates to which demo-
                        ratio.                                                graphic theory or model?
                      b. Australia and Oceania have a sex ratio skewed
                        toward males.
                      c. Southern South America has a sex ratio with                                   Population
                        females outnumbering males by more than 5                                                 Resources
                        percent.
                      d. Eastern Europe and Russia have a sex ratio
                        skewed toward females.                                   Quantity
                      e. Northern Africa has more females than males
                        due to pronatalist policies in those countries.
                   14.  What stage of the demographic transition model
                     has the greatest disparity between the birth rate
                     and the death rate?
                      a. Late stage 1         d. Early stage 4                                      Time  t 1
                      b. Late stage 2         e. Early stage 5                 a. Malthusian theory
                      c. Late stage 3                                          b. Demographic transition model
                  15.  Which country did not follow the progression of         c. Epidemiological model
                     the demographic transition model based on the             d. Population distribution theory
                     usual socioeconomic changes?                              e. Population density model
                      a. Sweden               d. United States
                      b. United Kingdom       e. Russia
                      c. China


                 128    Unit 2  Population and Migration Patterns and Process
                                    ©2021 BFW Publishers. Sample material is NOT FINAL and corrections will be made prior to publication.


          02_Hildebrhgap1e_19224_unit02_002_131_4pp.indd   128                                                                  05/19/20   6:08 PM