
Page 59 - bfw-APHG-1e
P. 59
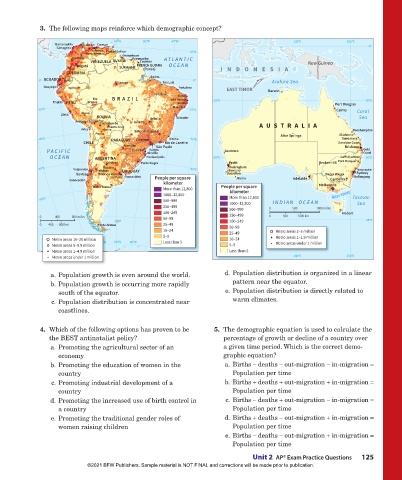
3. The following maps reinforce which demographic concept?
60°W 50°W 40°W 135°E 150°E
Barranquilla Maracaibo Caracas 0°
Cartagena
Valencia Ciudad Bolívar 10°N
Barquisimeto Georgetown
Medellín Paramaribo ATLANTIC
VENEZUELA GUYANA Cayenne New Guinea
Bogotá FRENCH GUIANA OCEAN
Cali SURINAME (france) INDONESIA
COLOMBIA
Belém
0° ECUADOR Quito 0° Arafura Sea
Manaus São Luís
Guayaquil Iquitos Fortaleza EAST TIMOR
Teresina Natal Darwin
Rio BRAZIL João Pessoa
Trujillo PERU Branco Recife 15°S Port Douglas 15°S
10°S Maceió 10°S Cairns Coral
Lima Cusco
BOLIVIA Brasília Salvador Sea
Arequipa La Paz Goiânia
Cochabamba
Santa Cruz AUSTRALIA
Arica Sucre Belo Horizonte Rockhampton
Potosí Alice Springs Gladstone
20°S PARAGUAY Campinas Vitória 20°S Bundaberg
CHILE Rio de Janeiro Sunshine Coast
Asunción São Paulo Brisbane
Santos
PACIFIC Curitiba Joinville Geraldton Gold
Coast
OCEAN ARGENTINA Florianópolis 30°S Coffs Harbour 30°S
Córdoba Porto Alegre Perth Broken Hill Port Macquarie
Rosario
30°S Valparaíso Mendoza URUGUAY 30°S Rockingham Newcastle
Bunbury
Santiago Buenos Aires Busselton Wagga Wagga Sydney
La Plata Montevideo People per square Albany Adelaide Wollongong
Concepción Canberra
kilometer
Bahía Blanca More than 12,800 People per square Melbourne
1000–12,800 kilometer Bass Strait
40°S 500–999 More than 12,800 INDIAN OCEAN Tasman
250–499 1000–12,800 0 500 1000 miles Sea
500–999
100–249 Hobart
0 400 800 miles 50–99 250–499 0 500 1000 km 45°S
0 400 800 km Punta Arenas 25–49 100–249
50–99
10–24 25–49 120°E Metro areas 2–5 million
120°E
120°E
5–9 Metro areas 1–1.9 million
Metro areas 10–20 million 70°W 60°W 50°W 30°W 20°W 10–24
Less than 5
20°W
20°W
20°W
30°W
30°W
70°W
70°W
70°W
90°W
90°W
90°W
Metro areas 5–9.9 million 5–9 120°E Metro areas under 1 million
120°E
120°E
Metro areas 1–4.9 million Less than 5
Metro areas under 1 million 135°E 150°E
a. Population growth is even around the world. d. Population distribution is organized in a linear
b. Population growth is occurring more rapidly pattern near the equator.
south of the equator. e. Population distribution is directly related to
c. Population distribution is concentrated near warm climates.
coastlines.
4. Which of the following options has proven to be 5. The demographic equation is used to calculate the
the BEST antinatalist policy? percentage of growth or decline of a country over
a. Promoting the agricultural sector of an a given time period. Which is the correct demo-
economy graphic equation?
b. Promoting the education of women in the a. Births − deaths − out-migration − in-migration =
country Population per time
c. Promoting industrial development of a b. Births + deaths + out-migration + in-migration =
country Population per time
d. Promoting the increased use of birth control in c. Births − deaths + out-migration − in-migration =
a country Population per time
e. Promoting the traditional gender roles of d. Births + deaths − out-migration + in-migration =
women raising children Population per time
e. Births − deaths − out-migration + in-migration =
Population per time
Unit 2 AP® Exam Practice Questions 125
©2021 BFW Publishers. Sample material is NOT FINAL and corrections will be made prior to publication.
02_Hildebrhgap1e_19224_unit02_002_131_4pp.indd 125 05/19/20 6:08 PM