
Page 28 - 2023-bfw-APES-4e-new.indd
P. 28
In this module, we learned how island size and distance because they have not evolved any defenses against the inva-
from a mainland affect the number of species present and sive species. In the next module, we will explore a related
their ecological roles. We also learned that some species liv- topic by focusing on how species have distinctive biotic and
ing on islands are particularly vulnerable to invasive species abiotic conditions under which they can live.
®
Module 10 AP Review Preparing for the AP Exam
®
Learning Goals Revisited
10-1 How does island biogeography affect which mainland source of species. Using a model of island bio-
species live on islands? geography, we can understand the combined effects of
island area and distance on the colonization rates and
For both oceanic islands and islands of habitat within a extinctions rates of different islands and predict the number
terrestrial landscape, islands with greater area contain of species that will be present at equilibrium.
more species. When plotted on a log scale, the relationship
of land area to species is linear with a similar slope among 10-3 Why are some species on islands particularly
many groups of plants and animals. Given the difference vulnerable to invasive species?
in number of species, small islands can contain fewer
predators than large islands and therefore experience dif- Many species that are native to islands have evolved into
ferent ecological relationships, including predator–prey specialists that can have a narrow diet and have not devel-
interactions. oped defenses against predators or pathogens. When inva-
sive species are introduced, many of them are generalists
10-2 What determines the number of species on that can consume the limited food of the native species or
islands? act as predators or pathogens that can decimate the island
species.
The number of species on an island depends on both the
area of the island and the distance from the island to a
®
®
AP Practice Questions Preparing for the AP Exam
Multiple-Choice Questions
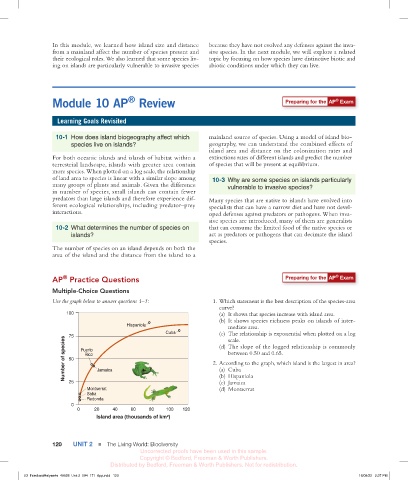
Use the graph below to answer questions 1–3: 1. Which statement is the best description of the species-area
curve?
100 (a) It shows that species increase with island area.
(b) It shows species richness peaks on islands of inter-
Hispaniola mediate area.
Cuba (c) The relationship is exponential when plotted on a log
75 (d) The slope of the logged relationship is commonly
Number of species 50 Puerto Jamaica 2. According to the graph, which island is the largest in area?
scale.
between 0.50 and 0.65.
Rico
(a) Cuba
(c) Jamaica
25
(d) Montserrat
Montserrat (b) Hispaniola
Saba
Redonda
0
0 20 40 60 80 100 120
Island area (thousands of km²)
120 UNIT 2 ■ The Living World: Biodiversity
Uncorrected proofs have been used in this sample.
Copyright © Bedford, Freeman & Worth Publishers.
Distributed by Bedford, Freeman & Worth Publishers. Not for redistribution.
03_FriedlandRelyea4e_40928_Unit 2_094_171_6pp.indd 120 16/08/22 2:37 PM