
Page 25 - 2023-bfw-APES-4e-new.indd
P. 25
50
40
Number of species present 30 Intermediate island
Near island
20
10
0 Far island
(a) (b) 0 40 80 120 160 200 240 280 320 360 400
Days after fumigation
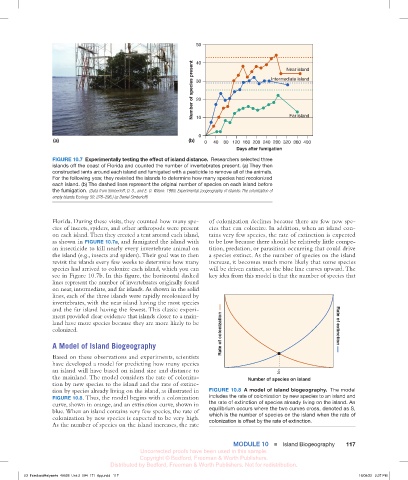
FIGURE 10.7 Experimentally testing the effect of island distance. Researchers selected three
islands off the coast of Florida and counted the number of invertebrates present. (a) They then
constructed tents around each island and fumigated with a pesticide to remove all of the animals.
For the following year, they revisited the islands to determine how many species had recolonized
each island. (b) The dashed lines represent the original number of species on each island before
the fumigation. (Data from Simberloff, D. S., and E. O. Wilson. 1969. Experimental zoogeography of islands: The colonization of
empty islands. Ecology 50: 278–296.) (a: Daniel Simberloff)
Florida. During these visits, they counted how many spe- of colonization declines because there are few new spe-
cies of insects, spiders, and other arthropods were present cies that can colonize. In addition, when an island con-
on each island. Then they erected a tent around each island, tains very few species, the rate of extinction is expected
as shown in FIGURE 10.7a, and fumigated the island with to be low because there should be relatively little compe-
an insecticide to kill nearly every invertebrate animal on tition, predation, or parasitism occurring that could drive
the island (e.g., insects and spiders). Their goal was to then a species extinct. As the number of species on the island
revisit the islands every few weeks to determine how many increase, it becomes much more likely that some species
species had arrived to colonize each island, which you can will be driven extinct, so the blue line curves upward. The
see in Figure 10.7b. In this figure, the horizontal dashed key idea from this model is that the number of species that
lines represent the number of invertebrates originally found
on near, intermediate, and far islands. As shown in the solid
lines, each of the three islands were rapidly recolonized by
invertebrates, with the near island having the most species
and the far island having the fewest. This classic experi-
ment provided clear evidence that islands closer to a main-
land have more species because they are more likely to be Rate of extinction
colonized. Rate of colonization
A Model of Island Biogeography
Based on these observations and experiments, scientists
have developed a model for predicting how many species
an island will have based on island size and distance to S
the mainland. The model considers the rate of coloniza- Number of species on island
tion by new species to the island and the rate of extinc-
tion by species already living on the island, as illustrated in FIGURE 10.8 A model of island biogeography. The model
FIGURE 10.8. Thus, the model begins with a colonization includes the rate of colonization by new species to an island and
curve, shown in orange, and an extinction curve, shown in the rate of extinction of species already living on the island. An
blue. When an island contains very few species, the rate of equilibrium occurs where the two curves cross, denoted as S,
which is the number of species on the island when the rate of
colonization by new species is expected to be very high. colonization is offset by the rate of extinction.
As the number of species on the island increases, the rate
ModUle 10 ■ Island Biogeography 117
Uncorrected proofs have been used in this sample.
Copyright © Bedford, Freeman & Worth Publishers.
Distributed by Bedford, Freeman & Worth Publishers. Not for redistribution.
03_FriedlandRelyea4e_40928_Unit 2_094_171_6pp.indd 117 16/08/22 2:37 PM