
Page 26 - 2023-bfw-APES-4e-new.indd
P. 26
one should find on the island occurs where the two lines We can also imagine how the model would change if we
ˆ
intersect; at this equilibrium point, denoted as S, the num- added a far island. As illustrated in Figure 10.9b, a far island
ber of species colonizing is offset by the number of species would experience a lower rate of colonization because
going extinct. fewer species could disperse to it. As a result, a far island is
Using this basic model as a foundation, we can now predicted to contain fewer species than a near island, as we
imagine what would happen to the number of species when can see by where its colonization curve crosses the extinc-
ˆ
we change island area or island distance to the mainland. We tion curve, denoted as S .
Far
can start by imagining how the model would change if we We can now combine the four options of large versus
added a larger island. As you can see in FIGURE 10.9a, a large small islands and near versus far island to have a complete
island would have a lower extinction rate because it could overview of the model. As shown in FIGURE 10.10, the
support larger populations of each species and larger popu- model predicts that large islands near the mainland should
lations are less likely to go extinct. As a result, a large island contain the highest number of species (denoted as S ˆ LN ).
is predicted to contain more species than a small island, as In contrast, small islands far from the mainland should
ˆ
we can see by where its extinction curve crosses the coloni- contain the lowest number of species (denoted as S ). As
SF
zation curve, denoted as S ˆ Large . you can see, the model predictions are quite consistent
with researchers’ observations of how many species live on
islands in nature and consistent with the experimental test
of island biogeography conducted on the small islands near
(a) Florida.
Implications for Species Conservation
Rate of colonization Small Rate of extinction the biodiversity found on oceanic islands and habitat islands
The research into island biogeography helps us understand
within a terrestrial landscape. The insights also provide guid-
ance for how to preserve biodiversity in setting aside habitats
Large
as national parks, national forests, and wildlife refuges. For
example, based on the observations from the model, we can
infer that setting aside larger tracts of land will allow us to
protect more species than a smaller tract of land. Moreover,
S Small S Large
Number of species on island
(b)
Rate of colonization Far Near Rate of extinction Rate of colonization Far Near Small Large Rate of extinction
S Far S Near
Number of species on island S SF S SN S LF S LN
Number of species on island
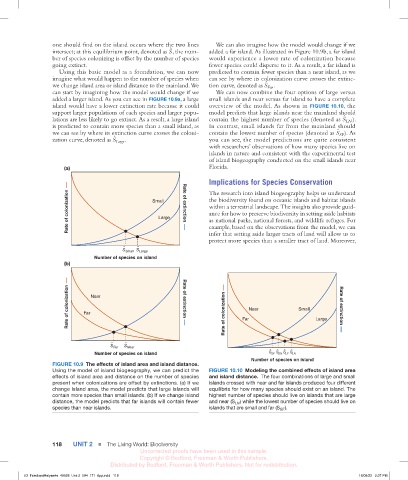
FIGURE 10.9 The effects of island area and island distance.
Using the model of island biogeography, we can predict the FIGURE 10.10 Modeling the combined effects of island area
effects of island area and distance on the number of species and island distance. The four combinations of large and small
present when colonizations are offset by extinctions. (a) If we islands crossed with near and far islands produced four different
change island area, the model predicts that large islands will equilibria for how many species should exist on an island. The
contain more species than small islands. (b) If we change island highest number of species should live on islands that are large
distance, the model predicts that far islands will contain fewer and near (S LN ) while the lowest number of species should live on
species than near islands. islands that are small and far (S SF ).
118 UNIT 2 ■ The Living World: Biodiversity
Uncorrected proofs have been used in this sample.
Copyright © Bedford, Freeman & Worth Publishers.
Distributed by Bedford, Freeman & Worth Publishers. Not for redistribution.
03_FriedlandRelyea4e_40928_Unit 2_094_171_6pp.indd 118 16/08/22 2:37 PM