
Page 43 - 2023-bfw-APES-4e-new.indd
P. 43
Section 2: Free-Response Questions (a) Identify the species richness of the plot where all of
the trees were cut down. (1 pt.)
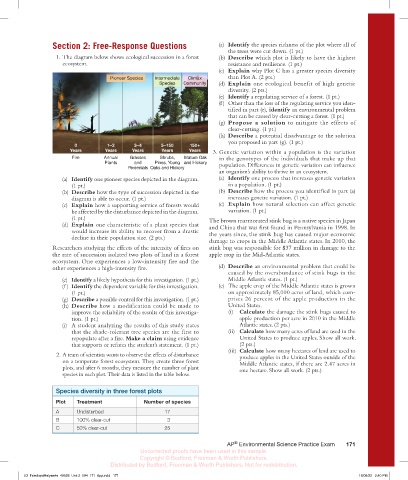
1. The diagram below shows ecological succession in a forest (b) Describe which plot is likely to have the highest
ecosystem. resistance and resilience. (1 pt.)
(c) Explain why Plot C has a greater species diversity
Pioneer Species Intermediate Climax than Plot A. (2 pts.)
Species Community (d) Explain one ecological benefit of high genetic
diversity. (2 pts.)
(e) Identify a regulating service of a forest. (1 pt.)
(f ) Other than the loss of the regulating service you iden-
tified in part (e), identify an environmental problem
that can be caused by clear-cutting a forest. (1 pt.)
(g) Propose a solution to mitigate the effects of
clear-cutting. (1 pt.)
(h) Describe a potential disadvantage to the solution
you proposed in part (g). (1 pt.)
0 1–2 3–4 5–150 150+
Years Years Years Years Years 3. Genetic variation within a population is the variation
Fire Annual Grasses Shrubs, Mature Oak in the genotypes of the individuals that make up that
Plants and Pines, Young and Hickory population. Differences in genetic variation can influence
Perennials Oaks and Hickory
an organism’s ability to thrive in an ecosystem.
(a) Identify one pioneer species depicted in the diagram. (a) Identify one process that increases genetic variation
(1 pt.) in a population. (1 pt.)
(b) Describe how the type of succession depicted in the (b) Describe how the process you identified in part (a)
FIRST PASS)
diagram is able to occur. (1 pt. increases genetic variation. (1 pt.)
(c) Explain how a supporting service of forests would (c) Explain how natural selection can affect genetic
fried_es4e_UN02_02_1418 - January 29, 2022
be affected by the disturbance depicted in the diagram. variation. (1 pt.)
(1 pt.) The brown marmorated stink bug is a native species in Japan
(d) Explain one characteristic of a plant species that and China that was first found in Pennsylvania in 1998. In
would increase its ability to recover from a drastic the years since, the stink bug has caused major economic
decline in their population size. (2 pts.)
damage to crops in the Middle Atlantic states. In 2010, the
Researchers studying the effects of the intensity of fires on stink bug was responsible for $37 million in damage to the
the rate of succession isolated two plots of land in a forest apple crop in the Mid-Atlantic states.
ecosystem. One experiences a low-intensity fire and the
other experiences a high-intensity fire. (d) Describe an environmental problem that could be
caused by the overabundance of stink bugs in the
(e) Identify a likely hypothesis for this investigation. (1 pt.) Middle Atlantic states. (1 pt.)
(f ) Identify the dependent variable for this investigation. (e) The apple crop of the Middle Atlantic states is grown
(1 pt.) on approximately 85,000 acres of land, which com-
(g) Describe a possible control for this investigation. (1 pt.) prises 26 percent of the apple production in the
(h) Describe how a modification could be made to United States.
improve the reliability of the results of this investiga- (i) Calculate the damage the stink bugs caused to
tion. (1 pt.) apple production per acre in 2010 in the Middle
(i) A student analyzing the results of this study states Atlantic states. (2 pts.)
that the shade-tolerant tree species are the first to (ii) Calculate how many acres of land are used in the
repopulate after a fire. Make a claim using evidence United States to produce apples. Show all work.
that supports or refutes the student’s statement. (1 pt.) (2 pts.)
(iii) Calculate how many hectares of land are used to
2. A team of scientists wants to observe the effects of disturbance produce apples in the United States outside of the
on a temperate forest ecosystem. They create three forest Middle Atlantic states, if there are 2.47 acres in
plots, and after 6 months, they measure the number of plant one hectare. Show all work. (2 pts.)
species in each plot. Their data is listed in the table below.
Species diversity in three forest plots
Plot Treatment Number of species
A Undisturbed 17
B 100% clear-cut 3
C 50% clear-cut 25
®
AP Environmental Science Practice Exam 171
Uncorrected proofs have been used in this sample.
Copyright © Bedford, Freeman & Worth Publishers.
Distributed by Bedford, Freeman & Worth Publishers. Not for redistribution.
03_FriedlandRelyea4e_40928_Unit 2_094_171_6pp.indd 171 16/08/22 2:40 PM