
Page 17 - Demo
P. 17
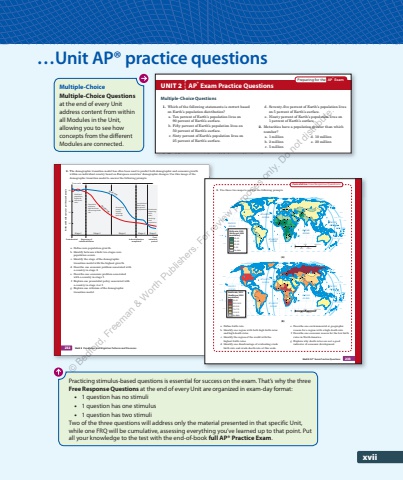
xvii226 Unit 2 Population and Migration%u00a0Patterns and%u00a0Processes Multiple-Choice Questions UNIT 2 AP %u00ae Exam Practice Questions 1. Which of the following statements is correct based on Earth%u2019s population distribution? a. Ten percent of Earth%u2019s population lives on 90%u00a0percent of Earth%u2019s surface. b. Fifty percent of Earth%u2019s population lives on 50%u00a0percent of Earth%u2019s surface. c. Sixty percent of Earth%u2019s population lives on 25%u00a0percent of Earth%u2019s surface. d. Seventy-five percent of Earth%u2019s population lives on 5 percent of Earth%u2019s surface. e. Ninety percent of Earth%u2019s population lives on 1%u00a0percent of Earth%u2019s surface. 2. Metacities have a population greater than which number? a. 1 million b. 2 million c. 5 million d. 10 million e. 20 million Preparing for the AP%u00ae Exam d. Population distribution is organized in a linear pattern near the equator. e. Population distribution is directly related to warm climates. a. Population growth is even around the world. b. Population growth is occurring more rapidly south of the equator. c. Population distribution is concentrated near coastlines. ATLANTICOCEANPACIFIC OCEAN90%u00b0W60%u00b0W 50%u00b0W50%u00b0W 30%u00b0W 20%u00b0W40%u00b0W70%u00b0W 60%u00b0W0%u00b00%u00b010%u00b0N10%u00b0S20%u00b0S30%u00b0S10%u00b0S20%u00b0S30%u00b0S40%u00b0SCOLOMBIAVENEZUELA GUYANASURINAME FRENCH GUIANA (France)BRAZILECUADORPERUBOLIVIAPARAGUAYURUGUAYCHILEARGENTINAS%u00e3o PauloBuenos AiresRio de JaneiroLimaBogot%u00e1SantiagoBelo HorizonteCaliBel%u00e9mRecifeCaracasGeorgetown Paramaribo CayenneGoi%u00e2niaMedell%u00ednBras%u00edlia SalvadorCampinasAsunci%u00f3nCuritibaMaracaiboGuayaquil FortalezaPorto AlegreManausSanta CruzNatalMacei%u00f3La Paz CochabambaC%u00f3rdobaMendoza RosarioJo%u00e3o PessoaBarranquillaFlorian%u00f3polisVit%u00f3ria S%u00e3o Lu%u00edsJoinvilleValenciaMontevideoBarquisimetoSantosCartagenaQuitoArequipaTeresinaLa PlataValpara%u00edsoConcepci%u00f3nBah%u00eda BlancaPunta ArenasSucrePotos%u00edCuscoAricaTrujilloIquitosCiudad Bol%u00edvarRio Branco0 400 800 miles0 400 800 kmMetro areas 10%u201320 millionMetro areas 5%u20139.9 millionMetro areas 1%u20134.9 millionMetro areas under 1 millionMore than 12,8001000%u201312,800500%u2013999250%u2013499100%u201324950%u20139925%u20134910%u2013245%u20139Fewer than 5People per square kilometerBass StraitTasmanSeaCoralSeaArafura SeaAUSTRALIAINDONESIAEAST TIMORINDIAN OCEANNew Guinea150%u00b0E150%u00b0E135%u00b0E135%u00b0E120%u00b0E0%u00b015%u00b0S 15%u00b0S30%u00b0S 30%u00b0S45%u00b0S120%u00b0ESydneyMelbournePerthBrisbaneAdelaideDarwinBroken HillAlice SpringsCairnsPort DouglasHobartCanberraWagga Wagga WollongongGeraldtonBunburyRockinghamBusseltonAlbanyGoldCoastNewcastlePort MacquarieCoffs HarbourSunshine CoastBundabergGladstoneRockhampton0 500 1000 miles0 500 1000 kmMore than 12,8001000%u201312,800500%u2013999250%u2013499100%u201324950%u20139925%u20134910%u2013245%u20139Fewer than 5People per square kilometerMetro areas 2%u20135 millionMetro areas 1%u20131.9 millionMetro areas under 1 million 3. The following maps reinforce which demographic concept? 232 Unit 2 Population and Migration%u00a0Patterns and%u00a0Processes 2. The demographic transition model has often been used to predict both demographic and economic growth within an individual country based on European countries%u2019 demographic changes. Use this image of the demographic transition model to answer the following prompts. Preindustrial Beginning ofindustrializationIndustrializationcompletedTime scale403020100PostindustrialperiodDeath rateBirthStabilized ratepopulation,high birthand deathratesDecreasinggrowth,rapidlydecliningbirth ratePopulation explosion, high birth rate,decreasing death rateLow birth and death rates,low growth of population Death ratesoutpacing birthrates, decliningtotal population Births and deaths per year per thousand peopleStage 1 Stage 2 Stage 3 Stage 4 Stage 5 a. Define zero population growth. b. Identify between which two stages zero population occurs. c. Identify the stage of the demographic transition model with the highest growth. d. Describe one economic problem associated with a country in stage 2. e. Describe one economic problem associated with a country in stage 5. f. Explain one pronatalist policy associated with a country in stage 4 or 5. g. Explain one criticism of the demographic transition model. Unit 2 AP%u00ae Exam Practice Questions 233Cumulative Free Response Questions 3. Use these two maps to answer the following prompts. Tropic of CancerArctic CircleTropic of CapricornEquatorPACIFICOCEANPACIFICOCEANATLANTICOCEANATLANTICOCEANINDIANOCEAN20%u00b0N20%u00b0S40%u00b0S40%u00b0N60%u00b0N80%u00b0N0%u00b020%u00b0N20%u00b0S40%u00b0S40%u00b0N60%u00b0N80%u00b0N0%u00b0160%u00b0W 140%u00b0W 100%u00b0W 80%u00b0W 60%u00b0W 40%u00b0W 20%u00b0W 0%u00b0 20%u00b0E 40%u00b0E 60%u00b0E 80%u00b0E 100%u00b0E 120%u00b0E 140%u00b0E 160%u00b0E 180%u00b0Tropic of CancerArctic CircleTropic of CapricornEquator0 2000 4000 miles0 2000 4000 km160%u00b0W 140%u00b0WBirth rate, 2021(births per 1000population)35%u20134525%u20133415%u2013240%u201314No data(A)Tropic of CancerArctic CircleTropic of CapricornEquatorPACIFICOCEANPACIFICOCEANATLANTICOCEANATLANTICOCEANINDIANOCEAN20%u00b0N20%u00b0S40%u00b0S40%u00b0N60%u00b0N80%u00b0N0%u00b020%u00b0N20%u00b0S40%u00b0S40%u00b0N60%u00b0N80%u00b0N0%u00b0160%u00b0W 140%u00b0W 120%u00b0W 100%u00b0W 80%u00b0W 60%u00b0W 40%u00b0W 20%u00b0W 0%u00b0 20%u00b0E 40%u00b0E 60%u00b0E 80%u00b0E 100%u00b0E 120%u00b0E 140%u00b0E 160%u00b0E 180%u00b0Tropic of CancerArctic CircleTropic of CapricornEquator0 2000 4000 miles0 2000 4000 kmOCEAN160%u00b0W 140%u00b0W 120%u00b0WDeath rate, 2021(deaths per 1000population)15%u20132110.0%u201314.98.0%u20139.97.0%u20137.91.0%u20136.9No data(B) a. Define birth rate. b. Identify one region with both high birth rates and high death rates. c. Identify the region of the world with the highest birth rates. d. Identify one disadvantage of evaluating crude birth rate and crude death rate at this scale. e. Describe one environmental or geographic reason for a region with a high death rate. f. Describe one economic reason for the low birth rates in North America. g. Explain why death rates are not a good indicator of economic development. %u2026Unit AP%u00ae practice questions Multiple-ChoiceMultiple-Choice Questionsat the end of every Unit address content from within all Modules in the Unit, allowing you to see how concepts from the different Modules are connected. Practicing stimulus-based questions is essential for success on the exam. That%u2019s why the three Free Response Questions at the end of every Unit are organized in exam-day format: %u2022 1 question has no stimuli %u2022 1 question has one stimulus %u2022 1 question has two stimuli Two of the three questions will address only the material presented in that specific Unit, while one FRQ will be cumulative, assessing everything you%u2019ve learned up to that point. Put all your knowledge to the test with the end-of-book full AP%u00ae Practice Exam . %u00a9 Bedford, Freeman & Worth Publishers. For review purposes only. Do not distribute.
