
Page 16 - Demo
P. 16
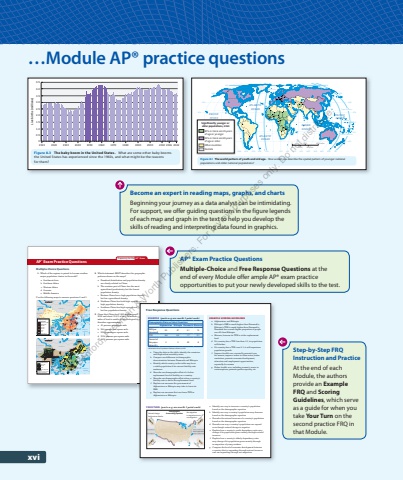
xvi122 Unit 2 Population and Migration%u00a0Patterns and%u00a0ProcessesXers in the United States in 2022, and according to the Pew Research Center, they will outnumber Baby Boomers in 2028. The Millennials (Generation Y) Those who were born between 1981 and 1996 are called millennials (sometimes also called Generation Y) ( Figure 8.4 ). This cohort%u2019s 72 million members make it the largest generation in the United States; it is also more diverse than older generations. As a group, the millennials are better educated than any generation before them, but they have also been hobbled by financial crises, including the Great Recession of 2007%u20132009. The Baby Boomers were born between 1946 and 1964 during the dramatic post%u2013World War II uptick in the U.S. birth rate ( Figure 8.3 ). The end of war and economic prosperity encouraged people to have more children, which gave rise to the %u201cbaby boom.%u201d In 2023, the youngest members of this generation were 59 years old and the oldest were in their late 70s, so many of the Baby Boomers have already retired or are on their way out of the workforce. The Baby Boomers have attracted much scholarly and media attention for several reasons. First, the number of Boomers is huge, estimated at 69 million people in 2022. Second, the Boomers played an important role Live births (millions)2.02.53.03.54.04.51.51.00.51910 1920 1930 1940 1950 1960 1970 1980 1990 2000 2010 2016 20220Figure 8.3 The baby boom in the United States. What are some other baby booms the%u00a0United States has experienced since the 1960s, and what might be the reasons for%u00a0them? Module 8 Population Composition 119A growing number of affluent countries have remarkably aged populations because their birth rates are low and people live a long life. In Italy, for example, 24 percent of the people are over the traditional retirement age of 65. Many other European countries are not far behind. A population%u2019s age structure can help us predict its future population growth, allowing us to estimate how many young people will need education and employment and how many elderly people we will need to support. These numbers also help us predict consumption patterns because young people and older people have very different needs. A country with a large population of young people will likely spend a lot of money on education, while a country with many elderly people will likely spend a lot of money on health care. post-reproductive (50 years and older), or we can divide the population into five-year age groups or cohorts (0%u20134 years, 4%u20139, 10%u201314, 15%u201319, and so on). We usually describe the age structure using percentages, but absolute numbers are fine, too. Thus, we can say that in 2020, (1) there were 73.1 million children younger than age 18 in the United States, or (2) children under 18 accounted for 22.1 percent of the U.S. population. The U.S. census is an important source of such data. As Figure 8.1 shows, age structure varies considerably among countries. Some countries have an overwhelmingly young population due to their high birth rates, which means that the proportions of the young people are relatively high. In most of the countries in Africa, as well as some countries in Latin America and tropical Asia, close to half the population is younger than 15 years old. In Niger, 49 percent of the Tropic of CancerArctic CircleTropic of CapricornEquatorPACIFICOCEANPACIFICOCEANATLANTICOCEANATLANTICOCEANINDIANOCEAN20%u00b0N20%u00b0S40%u00b0S40%u00b0N60%u00b0N80%u00b0N0%u00b020%u00b0N20%u00b0S40%u00b0S40%u00b0N60%u00b0N80%u00b0N0%u00b0160%u00b0W 100%u00b0W 80%u00b0W 60%u00b0W 40%u00b0W 20%u00b0W 0%u00b0 20%u00b0E 40%u00b0E 60%u00b0E 80%u00b0E 100%u00b0E 120%u00b0E 140%u00b0E 160%u00b0E 180%u00b0Tropic of CancerArctic CircleTropic of CapricornEquator0 2000 4000 miles0 2000 4000 kmOCEAN20%u00b0S40%u00b0S0%u00b0160%u00b0WSignificantly younger or older populations, 202340% or more are 15 yearsof age or younger15% or more are 65 yearsof age or olderOther countriesNo dataFigure 8.1 The world pattern of youth and old age. How would you describe the spatial pattern of younger national populations and older national populations? 116 Unit 2 Population and Migration%u00a0Patterns and%u00a0ProcessesAP %u00ae Exam Practice Questions Multiple-Choice Questions 1. Which of the regions is poised to become another major population cluster in the world? a. Southwest Asia b. Southern Africa c. Western Africa d. Oceania e. Middle America Use the following maps to answer questions 2 and 3. WuhanNanjingQuingdaoHangzhouZhengzhouChongqingZangzhouXi%u2019anBeijingTianjinChengduShanghaiGuangzhou ShenzhenMONGOLIAKAZAKHSTANKYRGYZSTANMYANMARBANGLADESHBHUTANLAOSVIETNAMTAIWANJAPANRUSSIANORTHKOREASOUTHKOREACHINA120%u00b0E130%u00b0E40%u00b0N30%u00b0N20%u00b0N90%u00b0E 110%u00b0EPACIFICOCEANEastChinaSeaSouth ChinaSeaBay ofBengalSea ofJapan(East Sea)BeijingTianjinChengduShanghaiGuangzhou ShenzhenShenyangWuhanNanjingQuingdaoHangzhouZhengzhouChongqingZangzhouXi%u2019anHong Kong FoshanSuzhouMONGOLIAKAZAKHSTANINDIAKYRGYZSTANMYANMARBANGLADESHBHUTANLAOSVIETNAMTAIWANJAPANRUSSIANORTHKOREASOUTHKOREACHINA0 250 500 miles0 250 500 kmINDIABANGLADESHMore than 12,8001000%u201312,800500%u2013999250%u2013499100%u201324925%u2013996%u201324Fewer than 6People per square kilometerWuhanNanjingQuingdaoHangzhouZhengzhouChongqingZangzhouXi%u2019anBeijingTianjinChengduShanghaiGuangzhou ShenzhenMONGOLIAKAZAKHSTANPAKISTANKYRGYZSTANMYANMARBANGLADESHBHUTANLAOSVIETNAMTAIWANJAPANRUSSIANORTHKOREASOUTHKOREACHINA120%u00b0E130%u00b0E40%u00b0N30%u00b0N20%u00b0N90%u00b0E 110%u00b0EPACIFICOCEANEastChinaSeaSouth ChinaSeaBay ofBengalSea ofJapan(East Sea)BeijingTianjinChengduShanghaiGuangzhou ShenzhenShenyangWuhanNanjingQuingdaoHangzhouZhengzhouChongqingZangzhouXi%u2019anHong Kong FoshanSuzhouMONGOLIAKAZAKHSTANINDIAPAKISTANKYRGYZSTANMYANMARBANGLADESHNEPAL BHUTANLAOSVIETNAMTAIWANJAPANRUSSIANORTHKOREASOUTHKOREACHINA0 250 500 miles0 250 500 kmINDIABANGLADESHNEPALBay ofBengalINDIABANGLADESHNEPALCultivated land (%)30 or more10 to 290 to 9Mostly degradedsoilSelected cities over 5 millionpopulation are labeled. 2. Which statement BEST describes the geographic patterns shown on the maps? a. Farmland distribution and population density are closely related in China. b. The western part of China has the most agricultural productivity but the lowest population density. c. Eastern China has a high population density but low agricultural density. d. Northern China has both high agricultural and high population density. e. Southern China has high agricultural density but low population density. 3. Given that China had 1426 million people in 2022 and about 11.6% of its 3.71 million square miles of land is arable, its physiological density is therefore approximately a. 45 persons per square mile b. 384 persons per square mile c. 522 persons per square mile d. 3314 persons per square mile e. 4454 persons per square mile Preparing for the AP%u00ae Exam d. Northern China has both high agricultural and e. Southern China has high agricultural density Given that China had 1426 million people in 2022 and about 11.6% of its 3.71 million square miles of land is arable, its physiological density is 142 Unit 2 Population and Migration%u00a0Patterns and%u00a0ProcessesEXAMPLE (parts a%u2013g are worth 1 point each)Demographic Data on Select Countries Afghanistan Ethiopia Denmark Morocco IMR (per thousand) 45 47 3.1 15 TFR 4.6 4.2 1.7 2.1 Percent of the population 65+ 2 3 20 8 Information from Population Reference Bureau, 2022. a. Using the data in the table, identify the countries with high infant mortality rates. b. Compare one difference in demographic characteristics between Denmark and Ethiopia. c. Identify which country in the table may have a stable population if its current fertility rate continues. d. Describe one demographic effect of a belowreplacement level of fertility on a country. e. Describe one demographic effect when a country%u2019s fertility rate is above the replacement level. f. Explain one measure the government of Afghanistan or Ethiopia may take to lower its IMR. g. Explain one measure that can lower TFR in Afghanistan or Ethiopia. EXAMPLE SCORING GUIDELINES a. Afghanistan and Ethiopia b. Ethiopia%u2019s IMR is much higher than Denmark%u2019s; Ethiopia%u2019s TFR is much higher than Denmark%u2019s; Denmark has a much higher proportion of people over 65 than Ethiopia. c. Morocco, because its TFR is at the replacement level d. If a country has a TFR less than 2.1, its population will decline. e. If a country has a TFR over 2.1, it will experience population growth. f. Improve health care, especially prenatal care for women; improve access to clean water, better sanitation; promote economic development, education and employment opportunities, especially for women g. Better health care, including women%u2019s access to contraceptives; promote gender equality, etc. Free Response Questions YOUR TURN (parts a%u2013g are worth 1 point each)Demographic Natural change: Accounting Equationbirths minus deathslevel of populationBirthsDeaths Net migration:in-migration minusout-migration In-migration migrationOut- a. Identify one way to increase a country%u2019s population based on the demographic equation. b. Identify one way a country%u2019s population may decrease based on the demographic equation. c. Describe the natural increase of a country%u2019s population based on the demographic equation. d. Describe one way a country%u2019s population can expand even though natural change is negative. e. Explain how a country%u2019s youth dependency ratio may change if its population grows mainly through natural increase. f. Explain how a country%u2019s elderly dependency ratio may change if its population grows mainly through in-migration of young workers. g. Compare the level of economic development between a country that is expanding through natural increase and one expanding through net migration. %u2026Module AP%u00ae practice questions Become an expert in reading maps, graphs, and charts Beginning your journey as a data analyst can be intimidating. For support, we offer guiding questions in the figure legends of each map and graph in the text to help you develop the skills of reading and interpreting data found in graphics. AP%u00ae Exam Practice QuestionsMultiple-Choice and Free Response Questions at the end of every Module offer ample AP%u00ae exam practice opportunities to put your newly developed skills to the test. Step-by-Step FRQ Instruction and Practice At the end of each Module, the authors provide an Example FRQ and Scoring Guidelines , which serve as a guide for when you take Your Turn on the second practice FRQ in that Module. %u00a9 Bedford, Freeman & Worth Publishers. For review purposes only. Do not distribute.
