
Page 56 - Demo
P. 56
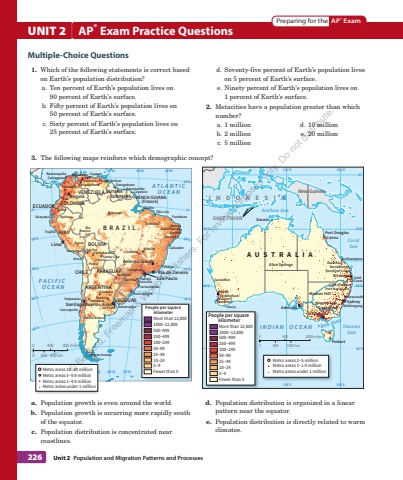
226 Unit 2 Population and Migration%u00a0Patterns and%u00a0Processes Multiple-Choice Questions UNIT 2 AP %u00ae Exam Practice Questions 1. Which of the following statements is correct based on Earth%u2019s population distribution? a. Ten percent of Earth%u2019s population lives on 90%u00a0percent of Earth%u2019s surface. b. Fifty percent of Earth%u2019s population lives on 50%u00a0percent of Earth%u2019s surface. c. Sixty percent of Earth%u2019s population lives on 25%u00a0percent of Earth%u2019s surface. d. Seventy-five percent of Earth%u2019s population lives on 5 percent of Earth%u2019s surface. e. Ninety percent of Earth%u2019s population lives on 1%u00a0percent of Earth%u2019s surface. 2. Metacities have a population greater than which number? a. 1 million b. 2 million c. 5 million d. 10 million e. 20 million Preparing for the AP%u00ae Exam d. Population distribution is organized in a linear pattern near the equator. e. Population distribution is directly related to warm climates. a. Population growth is even around the world. b. Population growth is occurring more rapidly south of the equator. c. Population distribution is concentrated near coastlines. ATLANTICOCEANPACIFIC OCEAN90%u00b0W60%u00b0W 50%u00b0W50%u00b0W 30%u00b0W 20%u00b0W40%u00b0W70%u00b0W 60%u00b0W0%u00b00%u00b010%u00b0N10%u00b0S20%u00b0S30%u00b0S10%u00b0S20%u00b0S30%u00b0S40%u00b0SCOLOMBIAVENEZUELA GUYANASURINAME FRENCH GUIANA(France)BRAZILECUADORPERUBOLIVIAPARAGUAYURUGUAYCHILEARGENTINAS%u00e3o PauloBuenos AiresRio de JaneiroLimaBogot%u00e1SantiagoBelo HorizonteCaliBel%u00e9mRecifeCaracasGeorgetown Paramaribo CayenneGoi%u00e2niaMedell%u00ednBras%u00edlia SalvadorCampinasAsunci%u00f3nCuritibaMaracaiboGuayaquil FortalezaPorto AlegreManausSanta CruzNatalMacei%u00f3La Paz CochabambaC%u00f3rdobaMendoza RosarioJo%u00e3o PessoaBarranquillaFlorian%u00f3polisVit%u00f3ria S%u00e3o Lu%u00edsJoinvilleValenciaMontevideoBarquisimetoSantosCartagenaQuitoArequipaTeresinaLa PlataValpara%u00edsoConcepci%u00f3nBah%u00eda BlancaPunta ArenasSucrePotos%u00edCuscoAricaTrujilloIquitosCiudad Bol%u00edvarRio Branco0 400 800 miles0 400 800 km90%u00b0W 70%u00b0W Metro areas 10%u201320 millionMetro areas 5%u20139.9 millionMetro areas 1%u20134.9 millionMetro areas under 1 million30%u00b0W 20%u00b0WMore than 12,8001000%u201312,800500%u2013999250%u2013499100%u201324950%u20139925%u20134910%u2013245%u20139Fewer than 5People per square kilometerBass StraitTasmanSeaCoralSeaArafura SeaAUSTRALIAINDONESIAEAST TIMORINDIAN OCEANNew Guinea150%u00b0E150%u00b0E135%u00b0E135%u00b0E120%u00b0E0%u00b015%u00b0S 15%u00b0S30%u00b0S 30%u00b0S45%u00b0S120%u00b0ESydneyMelbournePerthBrisbaneAdelaideDarwinBroken HillAlice SpringsCairnsPort DouglasHobartCanberraWagga Wagga WollongongGeraldtonBunburyRockinghamBusseltonAlbanyGoldCoastNewcastlePort MacquarieCoffs HarbourSunshine CoastBundabergGladstoneRockhampton0 500 1000 miles0 500 1000 km120%u00b0E120%u00b0E00More than 12,8001000%u201312,800500%u2013999250%u2013499100%u201324950%u20139925%u20134910%u2013245%u20139Fewer than 5People per square kilometerMetro areas 2%u20135 millionMetro areas 1%u20131.9 millionMetro areas under 1 million 3. The following maps reinforce which demographic concept? %u00a9 Bedford, Freeman & Worth Publishers. For review purposes only. Do not distribute.
