
Page 27 - 2023-ml-lewandowski-stats1e
P. 27
N independent observations, because we get a score for each partic-
ipant in the study. We are also estimating two population means,
one for each of our two conditions. So, our total degrees of freedom
are N − 2 (another way of thinking about this is that we are finding
the degrees of freedom for each sample and adding them together:
1 −= N − 2).
1
N 1 −+ N 2
In the case of our mindfulness meditation study, we had 80 total
observations, so we have 78 degrees of freedom. Another way to think
about this is to break our degrees of freedom down by condition, as we
did earlier in the chapter. Within each condition, we have 40 obser-
vations and one mean. So, each condition has 39 degrees of freedom,
which, when added together, totals 78.
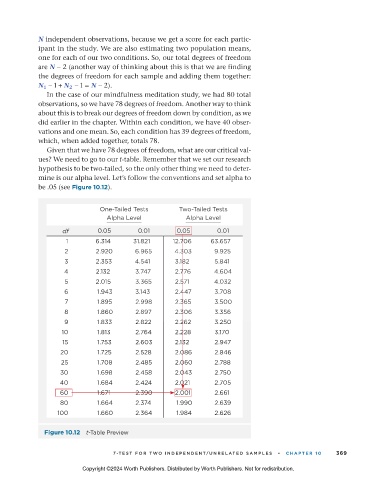
Given that we have 78 degrees of freedom, what are our critical val-
ues? We need to go to our t-table. Remember that we set our research
hypothesis to be two-tailed, so the only other thing we need to deter-
mine is our alpha level. Let’s follow the conventions and set alpha to
be .05 (see Figure 10.12).
One-Tailed Tests Two-Tailed Tests
Alpha Level Alpha Level
df 0.05 0.01 0.05 0.01
1 6.314 31.821 12.706 63.657
2 2.920 6.965 4.303 9.925
3 2.353 4.541 3.182 5.841
4 2.132 3.747 2.776 4.604
5 2.015 3.365 2.571 4.032
6 1.943 3.143 2.447 3.708
7 1.895 2.998 2.365 3.500
8 1.860 2.897 2.306 3.356
9 1.833 2.822 2.262 3.250
10 1.813 2.764 2.228 3.170
15 1.753 2.603 2.132 2.947
20 1.725 2.528 2.086 2.846
25 1.708 2.485 2.060 2.788
30 1.698 2.458 2.043 2.750
40 1.684 2.424 2.021 2.705
60 1.671 2.390 2.001 2.661
80 1.664 2.374 1.990 2.639
100 1.660 2.364 1.984 2.626
Figure 10.12 t-Table Preview
T -TES T F OR TW O INDEPENDENT/UNRELATED S AMPLES • CHAPTER 10 369
Copyright ©2024 Worth Publishers. Distributed by Worth Publishers. Not for redistribution.
11_statsresandlife1e_24717_ch10_343_389.indd 369 29/06/23 5:17 PM