
Page 29 - 2023-ml-lewandowski-stats1e
P. 29
Obviously, these two numbers aren’t equal. But, as it turns out, we
don’t know yet if they are different. We can’t say that these two num-
bers are truly different because both samples are subject to sampling
error. It’s possible that these two groups have equal variances at the
population level, but because we measured samples, we happened to
get variances that are slightly different from each other. So, how do we
evaluate whether these variances are equal or not equal? Well, we will
take the same approach to determine if the variances are equal that
we take to determine if the means are equal: we are going to conduct
a hypothesis test.
The particular hypothesis test is called Levene’s Test for Equal- Levene’s Test for Equality
ity of Variances, which is a variant of the F-test that we will learn of Variances a statistical
in Chapter 11. But even without knowing the details, we should analysis used to test the
be able to follow the general idea of this hypothesis test thanks equality of variances
to our general understanding of how hypothesis tests work. The assumption.
null hypothesis for Levene’s Test says that the variances of the
two groups are equal. The research hypothesis states that they are
not equal. Note that we want the variances to be equal, which is
what the null hypothesis says. So, this is an odd type of hypothesis
test, because we want to fail to reject the null. Most of the time, of
course, we want to reject the null hypothesis and retain the research
hypothesis.
Because we’ll talk about the math needed to calculate the F-score in
the next chapter, we are going to skip it for now and let SPSS calculate
the Levene’s Test F-score and p-value. Let’s take a look at the relevant
SPSS output in Figure 10.14.
Levene’s Test for Equality
of Variances
F Sig.
Stress Equal variances assumed 3.397 .069
Equal variances not assumed
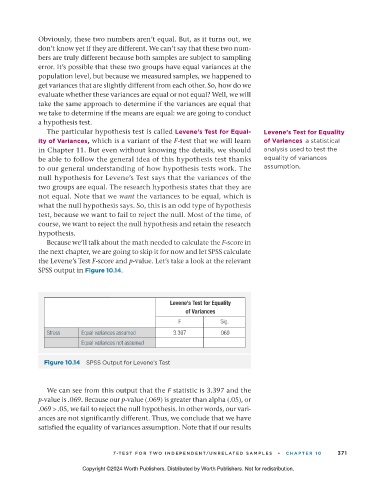
Figure 10.14 SPSS Output for Levene’s Test
We can see from this output that the F statistic is 3.397 and the
p-value is .069. Because our p-value (.069) is greater than alpha (.05), or
.069 > .05, we fail to reject the null hypothesis. In other words, our vari-
ances are not significantly different. Thus, we conclude that we have
satisfied the equality of variances assumption. Note that if our results
T -TES T F OR TW O INDEPENDENT/UNRELATED S AMPLES • CHAPTER 10 371
Copyright ©2024 Worth Publishers. Distributed by Worth Publishers. Not for redistribution.
11_statsresandlife1e_24717_ch10_343_389.indd 371 29/06/23 5:17 PM