
Page 54 - 2023-bfw-strayer-wow-5e-new.indd
P. 54
CHAPTER 4 AP ® EXAM PRACTICE
Multiple-Choice Questions Choose the correct answer for each question.
Questions 1–3 refer to this table.
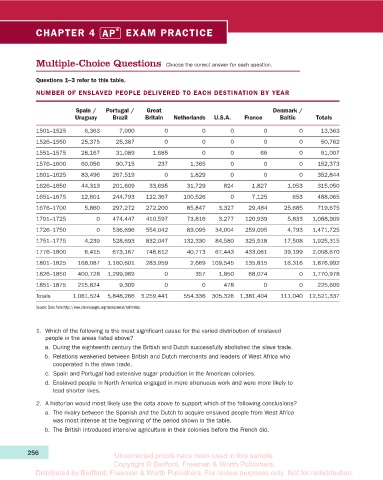
NUMBER OF ENSLAVED PEOPLE DELIVERED TO EACH DESTINATION BY YEAR
Spain / Portugal / Great Denmark /
Uruguay Brazil Britain Netherlands U.S.A. France Baltic Totals
1501–1525 6,363 7,000 0 0 0 0 0 13,363
1526–1550 25,375 25,387 0 0 0 0 0 50,762
1551–1575 28,167 31,089 1,685 0 0 66 0 61,007
1576–1600 60,056 90,715 237 1,365 0 0 0 152,373
1601–1625 83,496 267.519 0 1,829 0 0 0 352,844
1626–1650 44,313 201,609 33,695 31,729 824 1,827 1,053 315,050
1651–1675 12,601 244,793 122,367 100,526 0 7,125 653 488,065
1676–1700 5,860 297,272 272,200 85,847 3,327 29,484 25,685 719,675
1701–1725 0 474,447 410,597 73,816 3,277 120,939 5,833 1,088,909
1726–1750 0 536,696 554,042 83,095 34,004 259,095 4,793 1,471,725
1751–1775 4,239 528,693 832,047 132,330 84,580 325,918 17,508 1,925,315
1776–1800 6,415 673,167 748,612 40,773 67,443 433,061 39,199 2,008,670
1801–1825 168,087 1,160,601 283,959 2,669 109,545 135,815 16,316 1,876,992
1826–1850 400,728 1,299,969 0 357 1,850 68,074 0 1,770,978
1851–1875 215,824 9,309 0 0 478 0 0 225,609
Totals 1,061,524 5,848,266 3,259,441 554,336 305,326 1,381,404 111,040 12,521,337
Source: Data from http://www.slavevoyages.org/assessment/estimates.
1. Which of the following is the most significant cause for the varied distribution of enslaved
people in the areas listed above?
a. During the eighteenth century the British and Dutch successfully abolished the slave trade.
b. Relations weakened between British and Dutch merchants and leaders of West Africa who
cooperated in the slave trade.
c. Spain and Portugal had extensive sugar production in the American colonies.
d. Enslaved people in North America engaged in more strenuous work and were more likely to
lead shorter lives.
2. A historian would most likely use the data above to support which of the following conclusions?
a. The rivalry between the Spanish and the Dutch to acquire enslaved people from West Africa
was most intense at the beginning of the period shown in the table.
b. The British introduced intensive agriculture in their colonies before the French did.
256 Uncorrected proofs have been used in this sample.
Copyright © Bedford, Freeman & Worth Publishers.
Distributed by Bedford, Freeman & Worth Publishers. For review purposes only. Not for redistribution.
07_strayerap5e_40930_ch04_202-259_2pp.indd 256 7/4/22 9:51 AM