
Page 54 - 2023-bfw-Macro-Krugman-Econ-4e
P. 54
ModULE 1.6
4. Which of the following will lead to an increase in the 6. An increase in the number of buyers and a technological
equilibrium price of product X? advance will cause
a. an increase in consumer incomes if product X is an a. demand to increase and supply to increase.
inferior good b. demand to increase and supply to decrease.
b. an increase in the price of machinery used to produce c. demand to decrease and supply to increase.
product X d. demand to decrease and supply to decrease.
c. a technological advance in the production of good X e. no change in demand and an increase in supply.
d. a decrease in the price of good Y (a substitute for 7. Which of the following is certainly true if demand and
good X) supply increase at the same time?
e. an expectation by consumers that the price of good a. The equilibrium price will increase.
X is going to fall b. The equilibrium price will decrease.
5. The equilibrium price will rise, but the equilibrium c. The equilibrium quantity will increase.
quantity may increase, decrease, or stay the same if d. The equilibrium quantity will decrease.
a. demand increases and supply decreases. e. The equilibrium quantity may increase, decrease, or
b. demand increases and supply increases. stay the same.
c. demand decreases and supply increases.
d. demand decreases and supply decreases.
e. demand increases and supply does not change.
®
Tackle the AP Test: Free-Response Questions
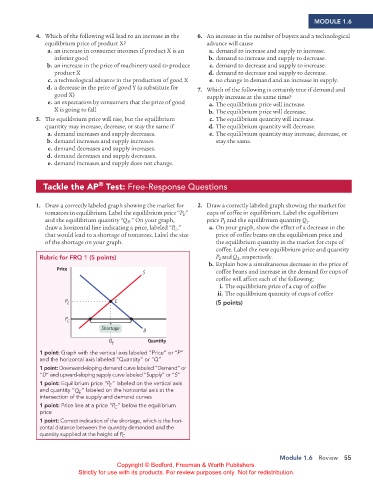
1. Draw a correctly labeled graph showing the market for 2. Draw a correctly labeled graph showing the market for
tomatoes in equilibrium. Label the equilibrium price “P ” cups of coffee in equilibrium. Label the equilibrium
E
and the equilibrium quantity “Q .” On your graph, price P and the equilibrium quantity Q .
1
1
E
draw a horizontal line indicating a price, labeled “P ,” a. On your graph, show the effect of a decrease in the
C
that would lead to a shortage of tomatoes. Label the size price of coffee beans on the equilibrium price and
of the shortage on your graph. the equilibrium quantity in the market for cups of
coffee. Label the new equilibrium price and quantity
Rubric for FRQ 1 (5 points) P and Q , respectively.
2
2
b. Explain how a simultaneous decrease in the price of
Price
S coffee beans and increase in the demand for cups of
coffee will affect each of the following;
i. The equilibrium price of a cup of coffee
ii. The equilibrium quantity of cups of coffee
P E E (5 points)
P C
Shortage D
Q E Quantity
1 point: Graph with the vertical axis labeled “Price” or “P”
and the horizontal axis labeled “Quantity” or “Q”
1 point: Downward-sloping demand curve labeled “Demand” or
“D” and upward-sloping supply curve labeled “Supply” or “S”
1 point: Equilibrium price “P ” labeled on the vertical axis
E
and quantity “Q ” labeled on the horizontal axis at the
E
intersection of the supply and demand curves
1 point: Price line at a price “P ” below the equilibrium
C
price
1 point: Correct indication of the shortage, which is the hori-
zontal distance between the quantity demanded and the
quantity supplied at the height of P C
Module 1.6 Review 55
Copyright © Bedford, Freeman & Worth Publishers.
Strictly for use with its products. For review purposes only. Not for redistribution.
02_APKrugman4e_40932_MacroU01_002_062.indd 55 05/07/22 10:51 AM