Page 50 - 2023-bfw-Macro-Krugman-Econ-4e
P. 50

ModULE 1.6
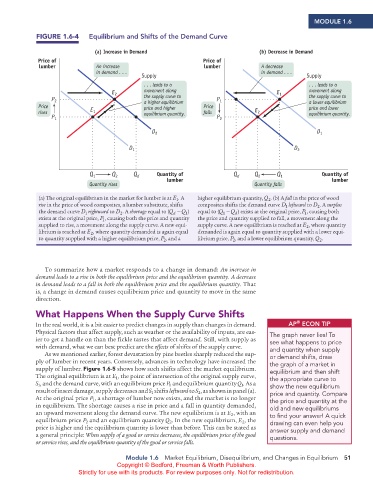
                    FIGURE 1.6-4    Equilibrium and Shifts of the demand Curve


                                       (a) Increase in Demand                                (b) Decrease in Demand
                    Price of                                              Price of
                     lumber            An increase                         lumber            A decrease
                                       in demand . . .                                       in demand . . .
                                                      Supply                                                Supply
                                                       . . . leads to a                                      . . . leads to a
                                            E 2        movement along                             E 1        movement along
                         P 2                           the supply curve to     P 1                           the supply curve to
                                                       a higher equilibrium
                                                                                                             a lower equilibrium
                    Price                              price and higher   Price                              price and lower
                    rises            E 1               equilibrium quantity.  falls        E 2               equilibrium quantity.
                         P 1                                                   P 2
                                                          D 2                                                  D 1


                                                  D 1                                                   D 2


                                     Q 1    Q 2     Q d    Quantity of              Q d    Q 2    Q 1            Quantity of
                                                              lumber                                                lumber
                                     Quantity rises                                        Quantity falls

                    (a) The original equilibrium in the market for lumber is at E . A   higher equilibrium quantity, Q . (b) A fall in the price of wood
                                                                 1
                                                                                                2
                    rise in the price of wood composites, a lumber substitute, shifts   composites shifts the demand curve D  leftward to D . A surplus
                                                                                                                2
                                                                                                     1
                    the demand curve D  rightward to D . A shortage equal to (Q d  −Q )   equal to (Q 1  −Q ) exists at the original price, P , causing both
                                                                                                           1
                                    1
                                               2
                                                                                     d
                                                                    1
                    exists at the original price, P , causing both the price and quantity   the price and quantity supplied to fall, a movement along the
                                         1
                    supplied to rise, a movement along the supply curve. A new equi-  supply curve. A new equilibrium is reached at E , where quantity
                                                                                                            2
                    librium is reached at E , where quantity demanded is again equal   demanded is again equal to quantity supplied with a lower equi-
                                      2
                    to quantity supplied with a higher equilibrium price, P , and a   librium price, P , and a lower equilibrium quantity, Q .
                                                                                    2
                                                                                                                2
                                                             2
                       To summarize how a market responds to a change in demand: An increase in
                    demand leads to a rise in both the equilibrium price and the equilibrium quantity. A decrease
                    in demand leads to a fall in both the equilibrium price and the equilibrium quantity. That
                    is, a change in demand causes equilibrium price and quantity to move in the same
                    direction.
                    What Happens When the Supply Curve Shifts
                                                                                                         ®
                    In the real world, it is a bit easier to predict changes in supply than changes in demand.   AP  ECoN TIP
                    Physical factors that affect supply, such as weather or the availability of inputs, are eas-  The graph never lies! To
                    ier to get a handle on than the fickle tastes that affect demand. Still, with supply as   see what happens to price
                    with demand, what we can best predict are the effects of shifts of the supply curve.  and quantity when supply
                       As we mentioned earlier, forest devastation by pine beetles sharply reduced the sup-  or demand shifts, draw
                    ply of lumber in recent years. Conversely, advances in technology have increased the   the graph of a market in
                    supply of lumber. Figure 1.6-5 shows how such shifts affect the market equilibrium.   equilibrium and then shift
                    The original equilibrium is at E , the point of intersection of the original supply curve,   the appropriate curve to
                                              1
                   S , and the demand curve, with an equilibrium price P  and equilibrium quantity Q . As a   show the new equilibrium
                                                               1
                                                                                       1
                    1
                    result of insect damage, supply decreases and S  shifts leftward to S , as shown in panel (a).     price and quantity. Compare
                                                                         2
                                                         1
                    At the original price P , a shortage of lumber now exists, and the market is no longer   the price and quantity at the
                                      1
                    in equilibrium. The shortage causes a rise in price and a fall in quantity demanded,   old and new equilibriums
                    an upward movement along the demand curve. The new equilibrium is at E , with an   to find your answer! A quick
                                                                                   2
                    equilibrium price P  and an equilibrium quantity Q . In the new equilibrium, E , the   drawing can even help you
                                    2
                                                               2
                                                                                       2
                    price is higher and the equilibrium quantity is lower than before. This can be stated as   answer supply and demand
                    a general principle: When supply of a good or service decreases, the equilibrium price of the good   questions.
                    or service rises, and the equilibrium quantity of the good or service falls.
                                                 Module 1.6  Market Equilibrium,  Disequilibrium, and Changes in Equilibrium  51
                                              Copyright © Bedford, Freeman & Worth Publishers.
                                 Strictly for use with its products. For review purposes only. Not for redistribution.
          02_APKrugman4e_40932_MacroU01_002_062.indd   51                                                              05/07/22   10:51 AM
   45   46   47   48   49   50   51   52   53   54   55