
Page 136 - Demo
P. 136
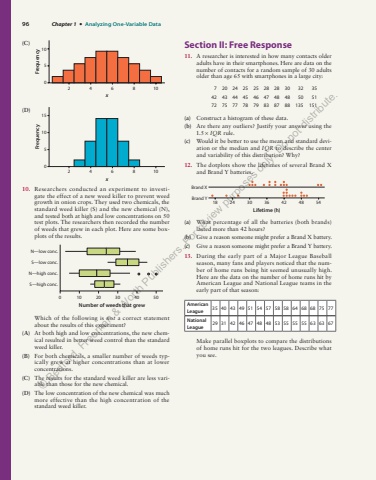
96 Chapter 1 %u2022 Analyzing One-Variable Data(C)205104 6xFrequency8 10(D)20510154 6xFrequency8 1010. Researchers conducted an experiment to investigate the effect of a new weed killer to prevent weed growth in onion crops. They used two chemicals, the standard weed killer (S) and the new chemical (N), and tested both at high and low concentrations on 50 test plots. The researchers then recorded the number of weeds that grew in each plot. Here are some boxplots of the results.N%u2014low conc.S%u2014low conc.N%u2014high conc.S%u2014high conc.0 10 20 30 40 50Number of weeds that grewWhich of the following is not a correct statement about the results of this experiment?(A) At both high and low concentrations, the new chemical resulted in better weed control than the standard weed killer.(B) For both chemicals, a smaller number of weeds typically grew at higher concentrations than at lower concentrations.(C) The results for the standard weed killer are less variable than those for the new chemical.(D) The low concentration of the new chemical was much more effective than the high concentration of the standard weed killer.Section II: Free Response11. A researcher is interested in how many contacts older adults have in their smartphones. Here are data on the number of contacts for a random sample of 30 adults older than age 65 with smartphones in a large city:7 20 24 25 25 28 28 30 32 3542 43 44 45 46 47 48 48 50 5172 75 77 78 79 83 87 88 135 151(a) Construct a histogram of these data.(b) Are there any outliers? Justify your answer using the 1.5 %u00d7 IQR rule.(c) Would it be better to use the mean and standard deviation or the median and IQR to describe the center and variability of this distribution? Why?12. The dotplots show the lifetimes of several Brand X and Brand Y batteries.18Brand YBrand X24 30 36Lifetime (h)42 48 54(a) What percentage of all the batteries (both brands) lasted more than 42 hours?(b) Give a reason someone might prefer a Brand X battery.(c) Give a reason someone might prefer a Brand Y battery.13. During the early part of a Major League Baseball season, many fans and players noticed that the number of home runs being hit seemed unusually high. Here are the data on the number of home runs hit by American League and National League teams in the early part of that season:American League 35 40 43 49 51 54 57 58 58 64 68 68 75 77National League 29 31 42 46 47 48 48 53 55 55 55 63 63 67Make parallel boxplots to compare the distributions of home runs hit for the two leagues. Describe what you see.%u00a9 Bedford, Freeman & Worth Publishers. For review purposes only. Do not distribute.
