
Page 134 - Demo
P. 134
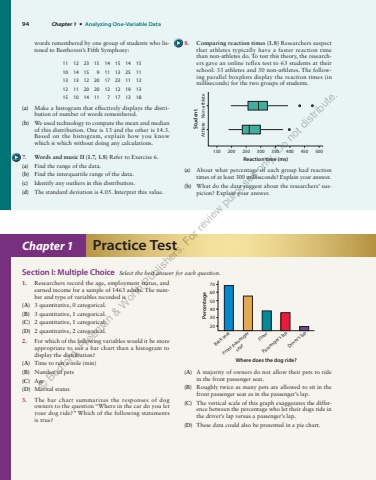
94 Chapter 1 %u2022 Analyzing One-Variable Datawords remembered by one group of students who listened to Beethoven%u2019s Fifth Symphony: 11 12 23 15 14 15 14 15 10 14 15 9 11 13 25 11 13 13 12 20 17 23 11 12 12 11 20 20 12 12 19 13 15 10 14 11 7 17 13 18 (a) Make a histogram that effectively displays the distribution of number of words remembered. (b) We used technology to compute the mean and median of this distribution. One is 13 and the other is 14.3. Based on the histogram, explain how you know which is which without doing any calculations. 7. Words and music II (1.7, 1.8) Refer to Exercise 6. (a) Find the range of the data. (b) Find the interquartile range of the data. (c) Identify any outliers in this distribution. (d) The standard deviation is 4.05. Interpret this value. 8. Comparing reaction times (1.8) Researchers suspect that athletes typically have a faster reaction time than non-athletes do. To test this theory, the researchers gave an online reflex test to 63 students at their school: 33 athletes and 30 non-athletes. The following parallel boxplots display the reaction times (in milliseconds) for the two groups of students. 150Athlete StudentReaction time (ms)Non-athlete200 250 300 350 400 450 500(a) About what percentage of each group had reaction times of at least 300 milliseconds? Explain your answer. (b) What do the data suggest about the researchers%u2019 suspicion? Explain your answer. Chapter 1 Practice Test 1. Researchers record the age, employment status, and earned income for a sample of 1463 adults. The number and type of variables recorded is (A) 3 quantitative, 0 categorical. (B) 3 quantitative, 1 categorical. (C) 2 quantitative, 1 categorical. (D) 2 quantitative, 2 categorical. 2. For which of the following variables would it be more appropriate to use a bar chart than a histogram to display the distribution? (A) Time to run a mile (min) (B) Number of pets (C) Age (D) Marital status 3. The bar chart summarizes the responses of dog owners to the question %u201cWhere in the car do you let your dog ride?%u201d Which of the following statements is true? 203040506070PercentageWhere does the dog ride?Back seatFront passengerseatFloorPassenger%u2019s lapDriver%u2019s lap(A) A majority of owners do not allow their pets to ride in the front passenger seat. (B) Roughly twice as many pets are allowed to sit in the front passenger seat as in the passenger%u2019s lap. (C) The vertical scale of this graph exaggerates the difference between the percentage who let their dogs ride in the driver%u2019s lap versus a passenger%u2019s lap. (D) These data could also be presented in a pie chart. Section I: Multiple Choice Select the best answer for each question.%u00a9 Bedford, Freeman & Worth Publishers. For review purposes only. Do not distribute.
