
Page 131 - Demo
P. 131
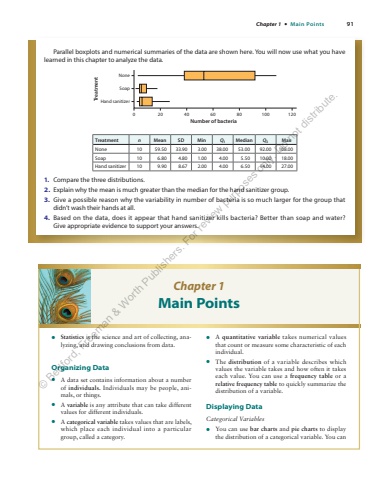
Chapter 1 %u2022 Main Points 91 Parallel boxplots and numerical summaries of the data are shown here. You will now use what you have learned in this chapter to analyze the data. 0NoneSoapHand sanitizer TreatmentNumber of bacteria20 40 60 80 100 120Treatment n Mean SD Min Q1 Median Q3 Max None 10 59.50 33.90 3.00 38.00 53.00 92.00 108.00 Soap 10 6.80 4.80 1.00 4.00 5.50 10.00 18.00 Hand sanitizer 10 9.90 8.67 2.00 4.00 6.50 14.00 27.00 1. Compare the three distributions. 2. Explain why the mean is much greater than the median for the hand sanitizer group. 3. Give a possible reason why the variability in number of bacteria is so much larger for the group that didn%u2019t wash their hands at all. 4. Based on the data, does it appear that hand sanitizer kills bacteria? Better than soap and water? Give appropriate evidence to support your answers. Chapter 1 Main Points %u2022%u2022 Statistics is the science and art of collecting, analyzing, and drawing conclusions from data. Organizing Data %u2022%u2022 A data set contains information about a number of individuals. Individuals may be people, animals, or things. %u2022%u2022 A variable is any attribute that can take different values for different individuals. %u2022%u2022 A categorical variable takes values that are labels, which place each individual into a particular group, called a category. %u2022%u2022 A quantitative variable takes numerical values that count or measure some characteristic of each individual. %u2022%u2022 The distribution of a variable describes which values the variable takes and how often it takes each value. You can use a frequency table or a relative frequency table to quickly summarize the distribution of a variable. Displaying Data Categorical Variables%u2022%u2022 You can use bar charts and pie charts to display the distribution of a categorical variable. You can %u00a9 Bedford, Freeman & Worth Publishers. For review purposes only. Do not distribute.
