
Page 135 - Demo
P. 135
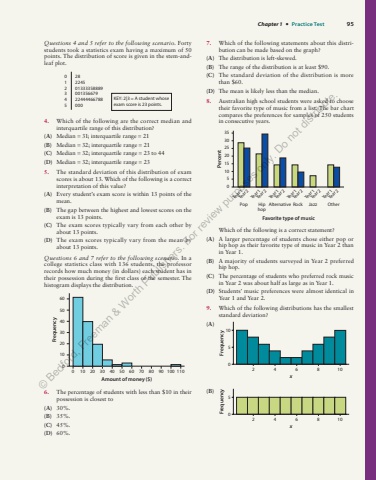
Chapter 1 %u2022 Practice Test 95Questions 4 and 5 refer to the following scenario. Forty students took a statistics exam having a maximum of 50 points. The distribution of score is given in the stem-andleaf plot.0 281 22452 013333588893 0013566794 224444667885 000KEY: 2|3 = A student whoseexam score is 23 points.4. Which of the following are the correct median and interquartile range of this distribution?(A) Median = 31; interquartile range 2 = 1(B) Median = 32; interquartile range 2 = 1(C) Median = 32; interquartile range 2 = 3 to 44(D) Median = 32; interquartile range 2 = 35. The standard deviation of this distribution of exam scores is about 13. Which of the following is a correct interpretation of this value?(A) Every student%u2019s exam score is within 13 points of the mean.(B) The gap between the highest and lowest scores on the exam is 13 points.(C) The exam scores typically vary from each other by about 13 points.(D) The exam scores typically vary from the mean by about 13 points.Questions 6 and 7 refer to the following scenario. In a college statistics class with 136 students, the professor records how much money (in dollars) each student has in their possession during the first class of the semester. The histogram displays the distribution.Amount of money ($)060Frequency0504030201010 20 30 40 70 50 80 60 90 100 1106. The percentage of students with less than $10 in their possession is closest to(A) 30%.(B) 35%.(C) 45%.(D) 60%.7. Which of the following statements about this distribution can be made based on the graph?(A) The distribution is left-skewed.(B) The range of the distribution is at least $90.(C) The standard deviation of the distribution is more than $60.(D) The mean is likely less than the median.8. Australian high school students were asked to choose their favorite type of music from a list. The bar chart compares the preferences for samples of 250 students in consecutive years.3530252015 PercentFavorite type of music1050PopYear 1Year 2Year 1 Year 2Year 1 Year 2Year 1Year 2Year 1 Year 2Year 1Year 2HiphopAlternative Rock Jazz OtherWhich of the following is a correct statement?(A) A larger percentage of students chose either pop or hip hop as their favorite type of music in Year 2 than in Year 1.(B) A majority of students surveyed in Year 2 preferred hip hop.(C) The percentage of students who preferred rock music in Year 2 was about half as large as in Year 1.(D) Students%u2019 music preferences were almost identical in Year 1 and Year 2.9. Which of the following distributions has the smallest standard deviation?(A)205104 6xFrequency8 10(B)2054 6xFrequency8 10%u00a9 Bedford, Freeman & Worth Publishers. For review purposes only. Do not distribute.
