
Page 37 - Demo
P. 37
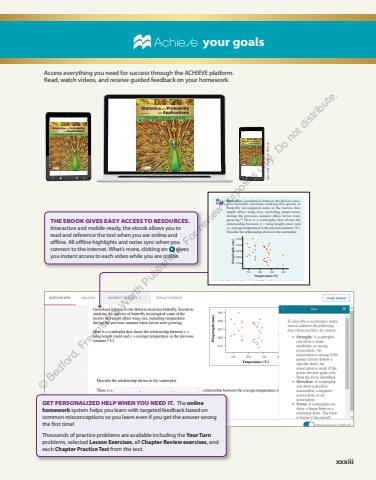
xxxiii THE EBOOK GIVES EASY ACCESS TO RESOURCES. Interactive and mobile-ready, the ebook allows you to read and reference the text when you are online and offline. All offline highlights and notes sync when you connect to the internet. What%u2019s more, clicking on gives you instant access to each video while you are online. your goals Access everything you need for success through the ACHIEVE platform. Read, watch videos, and receive guided feedback on your homework. GET PERSONALIZED HELP WHEN YOU NEED IT. The online homework system helps you learn with targeted feedback based on common misconceptions so you learn even if you get the answer wrong the first time! Thousands of practice problems are available including the Your Turnproblems, selected Lesson Exercises , all Chapter Review exercises , and each Chapter Practice Test from the text. Lesson 3.2 %u2022 Relationships Between Two Quantitative Variables 183 Mastering Concepts and Skills 7. Putting success How well do professional golfers putt from different distances to the hole? The data show various distances to the hole (in feet) and the percentage of putts made at each distance for a sample of golfers. 18 Make a scatterplot by hand that shows how the percentage of putts made relates to the distance of the putt. Distance (ft) Percent made Distance (ft) Percent made Distance (ft) Percent made 2 93.3 9 31.8 16 13.4 3 83.1 10 33.5 17 15.9 4 74.1 11 31.6 18 17.3 5 58.9 12 25.7 19 13.6 6 54.8 13 24.0 20 15.8 7 53.1 14 31.0 8 46.3 15 16.8 8. How much to carry? Ninth-grade students at a residential school go on a backpacking trip each fall. Students are divided into hiking groups of size 8 by selecting names from a hat. Before leaving, students and their backpacks are weighed. The data here are from a group of hikers whom one of the authors accompanied. Make a scatterplot by hand that shows how backpack weight relates to body weight. Body weight (lb) 120 187 109 103 131 165 158 116 Backpack weight (lb) 26 30 26 24 29 35 31 28 9. Coaster crazy Many people like to ride roller coasters. Amusement parks try to attract visitors by offering roller coasters that have a variety of speeds and elevations. The table shows data for nine roller coasters. 19 Make a scatterplot to show the relationship between height and maximum speed. Roller coaster Height (ft) Maximum speed (mph) Apocalypse 100 55 Bullet 196 83 Corkscrew 70 55 Flying Turns 50 24 Goliath 192 66 Hidden Anaconda 152 65 Iron Shark 100 52 Stinger 131 50 Wild Eagle 210 61 10. How%u2019s the weather up there? The table presents data on the elevation (in feet) and average January temperature (in degrees Fahrenheit) for 10 cities and towns in Colorado. 20 Make a scatterplot to show the relationship between elevation and average temperature in January. City Elevation (ft) Average January temperature ( %u00b0F ) Limon 5452 27 Denver 5232 31 Golden 6408 29 Flagler 5002 29 Eagle 6595 21 Vail 8220 18 Glenwood Springs 7183 25 Rifle 5386 26 Grand Junction 4591 29 Dillon 9049 16 11. Butterflies Greenland is home to the Boloria chariclea butterfly. Scientists studying this species of butterfly investigated some of the factors that might affect wing size, including temperature during the previous summer when larvae were growing. 21 Here is a scatterplot that shows the relationship between y = wing length (mm) and x = average temperature in the previous summer ( %u00b0C). Describe the relationship shown in the scatterplot. 1.0 2.0Temperature (%u00b0C)Wing length (mm)3.0 4.019.519.018.518.017.512. Heads, tails, or edge? When flipping a coin onto a table, it is very unlikely to land on its edge. What if you glued several pennies together and then flipped the stack? The students in Mrs. Chauvet%u2019s statistics class collected data by repeatedly flipping stacks up to 27 pennies long. 22 The scatterplot shows the relationship between number of pennies in the stack and edge percentage. Describe the relationship. 8060100402000 1 5 0 15 20 25Edge percentageNumber of penniespg 179pg 18104_StarnesSPA5e_53579_ch03_164_249.indd 183 22/11/24 1:06 PM sdecoret / Deposit Photos %u00a9 Bedford, Freeman & Worth Publishers. For review purposes only. Do not distribute.
