
Page 45 - Demo
P. 45
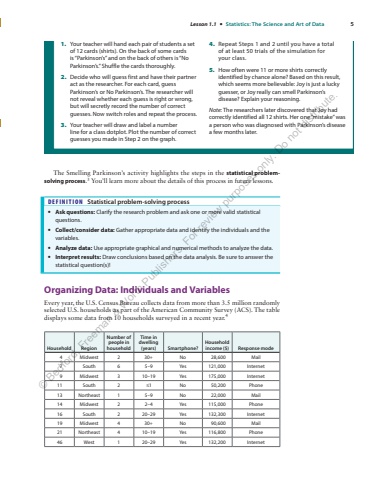
Lesson 1.1 %u2022 Statistics: The Science and Art%u00a0of Data 5The Smelling Parkinson%u2019s activity highlights the steps in the statistical problemsolving process.3 You%u2019ll learn more about the details of this process in future lessons.DEFINITION Statistical problem-solving process%u2022 Ask questions: Clarify the research problem and ask one or more valid statistical questions.%u2022 Collect/consider data: Gather appropriate data and identify the individuals and the variables.%u2022 Analyze data: Use appropriate graphical and numerical methods to analyze the data.%u2022 Interpret results: Draw conclusions based on the data analysis. Be sure to answer the statistical question(s)!Organizing Data: Individuals and VariablesEvery year, the U.S. Census Bureau collects data from more than 3.5 million randomly selected U.S. households as part of the American Community Survey (ACS). The table displays some data from 10 households surveyed in a recent year.4Household RegionNumber of people in householdTime in dwelling (years) Smartphone?Household income ($) Response mode4 Midwest 2 30+ No 28,600 Mail7 South 6 5%u20139 Yes 121,000 Internet9 Midwest 3 10%u201319 Yes 175,000 Internet11 South 2 %u22641 No 50,200 Phone13 Northeast 1 5%u20139 No 22,000 Mail14 Midwest 2 2%u20134 Yes 115,000 Phone16 South 2 20%u201329 Yes 132,300 Internet19 Midwest 4 30+ No 90,600 Mail21 Northeast 4 10%u201319 Yes 116,800 Phone46 West 1 20%u201329 Yes 132,200 Internet1. Your teacher will hand each pair of students a set of 12 cards (shirts). On the back of some cards is %u201cParkinson%u2019s%u201d and on the back of others is %u201cNo Parkinson%u2019s.%u201d Shuffle the cards thoroughly.2. Decide who will guess first and have their partner act as the researcher. For each card, guess Parkinson%u2019s or No Parkinson%u2019s. The researcher will not reveal whether each guess is right or wrong, but will secretly record the number of correct guesses. Now switch roles and repeat the process.3. Your teacher will draw and label a number line%u00a0for a class dotplot. Plot the number of correct guesses you made in Step 2 on the graph.4. Repeat Steps 1 and 2 until you have a total of at least 50 trials of the simulation for your%u00a0class.5. How often were 11 or more shirts correctly identified by chance alone? Based on this result, which seems more believable: Joy is just a lucky guesser, or Joy really can smell Parkinson%u2019s disease? Explain your reasoning.Note: The researchers later discovered that Joy had correctly identified all 12 shirts. Her one %u201cmistake%u201d was a person who was diagnosed with Parkinson%u2019s disease a few months later.%u00a9 Bedford, Freeman & Worth Publishers. For review purposes only. Do not distribute.
