
Page 49 - Demo
P. 49
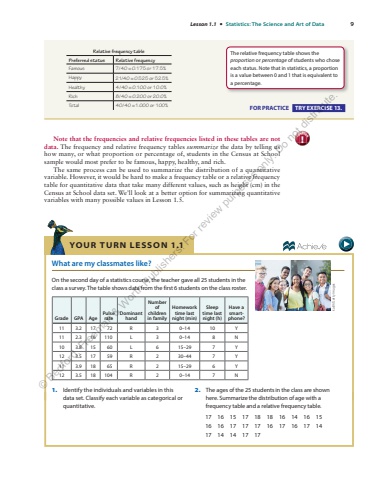
Lesson 1.1 %u2022 Statistics: The Science and Art%u00a0of Data 9Note that the frequencies and relative frequencies listed in these tables are not data. The frequency and relative frequency tables summarize the data by telling us how many, or what proportion or percentage of, students in the Census at School sample would most prefer to be famous, happy, healthy, and rich. The same process can be used to summarize the distribution of a quantitative variable. However, it would be hard to make a frequency table or a relative frequency table for quantitative data that take many different values, such as height (cm) in the Census at School data set. We%u2019ll look at a better option for summarizing quantitative variables with many possible values in Lesson 1.5. caution! Relative frequency table Preferred status Relative frequency Famous 7/40 0.175 = or 17.5% Happy 21/40 0= .525 or 52.5% Healthy 4/40 0.100 = or 10.0% Rich 8/40 0.200 = or 20.0% Total 40/40 1= .000 or 100% FOR PRACTICE TRY EXERCISE 13. The relative frequency table shows the proportion or percentage of students who chose each status. Note that in statistics, a proportion is a value between 0 and 1 that is equivalent to a percentage. YO U R TU R N LE SSO N 1.1 What are my classmates like? On the second day of a statistics course, the teacher gave all 25 students in the class a survey. The table shows data from the first 6 students on the class roster. Grade GPA Age Pulse rate Dominant hand Number of children in family Homework time last night (min) Sleep time last night (h) Have a smartphone? 11 3.2 17 72 R 3 0%u201314 10 Y 11 2.3 16 110 L 3 0%u201314 8 N 10 3.8 15 60 L 6 15%u201329 7 Y 12 3.5 17 59 R 2 30%u201344 7 Y 11 3.9 18 65 R 2 15%u201329 6 Y 12 3.5 18 104 R 2 0%u201314 7 N kali9/Getty Images 1. Identify the individuals and variables in this data set. Classify each variable as categorical or quantitative. 2. The ages of the 25 students in the class are shown here. Summarize the distribution of age with a frequency table and a relative frequency table. 17 16 15 17 18 18 16 14 16 15 16 16 17 17 17 16 17 16 17 14 17 14 14 17 17 %u00a9 Bedford, Freeman & Worth Publishers. For review purposes only. Do not distribute.
