
Page 47 - Demo
P. 47
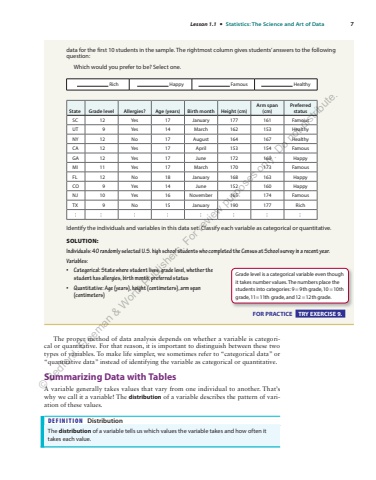
Lesson 1.1 %u2022 Statistics: The Science and Art%u00a0of Data 7data for the first 10%u00a0students in the sample. The rightmost column gives students%u2019 answers to the following question: Which would you prefer to be? Select one. Rich Happy Famous Healthy State Grade level Allergies? Age (years) Birth month Height (cm) Arm span (cm) Preferred status SC 12 Yes 17 January 177 161 Famous UT 9 Yes 14 March 162 153 Healthy NY 12 No 17 August 164 167 Healthy CA 12 Yes 17 April 153 154 Famous GA 12 Yes 17 June 172 169 Happy MI 11 Yes 17 March 170 173 Famous FL 12 No 18 January 168 163 Happy CO 9 Yes 14 June 152 160 Happy NJ 10 Yes 16 November 165 174 Famous TX 9 No 15 January 190 177 Rich fi fi fi fi fi fi fi fi Identify the individuals and variables in this data set. Classify each variable as categorical or quantitative. SOLUTION: Individuals: 40 randomly selected U.S. high school students who completed the Census at School survey in a recent year. Variables: %u2022 Categorical: State where student lives, grade level, whether the student has allergies, birth month, preferred status %u2022 Quantitative: Age (years), height (centimeters), arm span (centimeters) FOR PRACTICE TRY EXERCISE 9. Grade level is a categorical variable even though it takes number values. The numbers place the students into categories: 9 = 9th grade, 10 1 = 0thgrade, 11 1 = 1th grade, and 12 1 = 2th grade. The proper method of data analysis depends on whether a variable is categorical or quantitative. For that reason, it is important to distinguish between these two types of variables. To make life simpler, we sometimes refer to %u201ccategorical data%u201d or %u201cquantitative data%u201d instead of identifying the variable as categorical or quantitative. Summarizing Data with Tables A variable generally takes values that vary from one individual to another. That%u2019s why we call it a variable! The distribution of a variable describes the pattern of variation of these values. DEFINITION Distribution The distribution of a variable tells us which values the variable takes and how often it takes each value. %u00a9 Bedford, Freeman & Worth Publishers. For review purposes only. Do not distribute.
