
Page 48 - Demo
P. 48
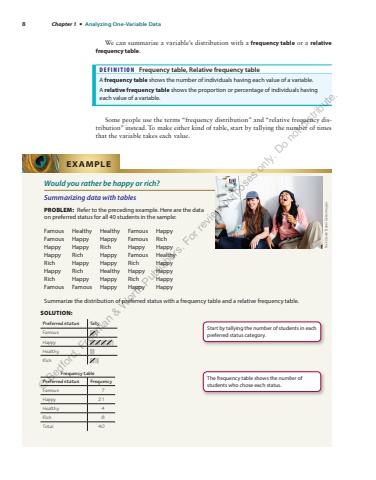
8 Chapter 1 %u2022 Analyzing One-Variable Data We can summarize a variable%u2019s distribution with a frequency table or a relative frequency table.DEFINITION Frequency table, Relative frequency table A frequency table shows the number of individuals having each value of a variable. A relative frequency table shows the proportion or percentage of individuals having each value of a variable. Some people use the terms %u201cfrequency distribution%u201d and %u201crelative frequency distribution%u201d instead. To make either kind of table, start by tallying the number of times that the variable takes each value. Would you rather be happy or rich? Summarizing data with tables PROBLEM: Refer to the preceding example. Here are the data on preferred status for all 40 students in the sample: Famous Healthy Healthy Famous Happy Famous Happy Happy Famous Rich Happy Happy Rich Happy Happy Happy Rich Happy Famous Healthy Rich Happy Happy Rich Happy Happy Rich Healthy Happy Happy Rich Happy Happy Rich Happy Famous Famous Happy Happy Happy Summarize the distribution of preferred status with a frequency table and a relative frequency table. EXAMPLE Nick David/Stone/Getty ImagesSOLUTION: Preferred status Tally Famous |||| || Happy |||| |||| |||| |||| | Healthy |||| Rich |||| ||| Frequency table Preferred status Frequency Famous 7 Happy 21 Healthy 4 Rich 8 Total 40 Start by tallying the number of students in each preferred status category. The frequency table shows the number of students who chose each status. %u00a9 Bedford, Freeman & Worth Publishers. For review purposes only. Do not distribute.
