
Page 21 - bfw-APHG-1e
P. 21
the fourth most populous country in the world and still
TERMS TO KNOW . . . the only developed country in the group. Population
developed (or industrialized) country: A country with changes in these countries can greatly affect global pop-
an advanced economy and a high standard of living ulation growth trends and distribution patterns.
developing (or industrializing) countries: Countries
that are of relatively low income or economically poorer Sparsely Populated Areas
than developed countries
Though the information about population clusters may
imply that our planet is crowded, sparsely populated
noting: of the top 10 most populated countries, only the areas are actually much more extensive than densely
United States is a developed (or industrialized) country, populated ones. There are unpopulated areas on every
meaning it is a country with an advanced economy and continent. These “empty quarters” reflect the human
a high standard of living. All the others, including Rus- tendency to avoid places that are too cold, too dry, too
sia, are developing (or industrializing) countries, or coun- wet, too rugged, or too barren. As seen in Figure 7.1,
tries that are of relatively low income or economically major examples of sparsely settled areas include the
poorer than developed countries. Although the United northern sections of Eurasia and North America (too
States is currently the third most populous country, it cold), the extensive desert belt from North Africa
has only 4.3 percent of the world’s population. through the Arabian Peninsula, to the heart of Eurasia,
The top 10 list will change in the near future due to and most of Australia (too dry), the Amazon basin (too
different rates of population growth. China and India wet), and the Tibetan Plateau (too rugged and cold).
will switch their spots; Nigeria, currently seventh, will
move up the rank to become the third most populous National and Local Patterns
country. Russia and Mexico are expected to fall off the
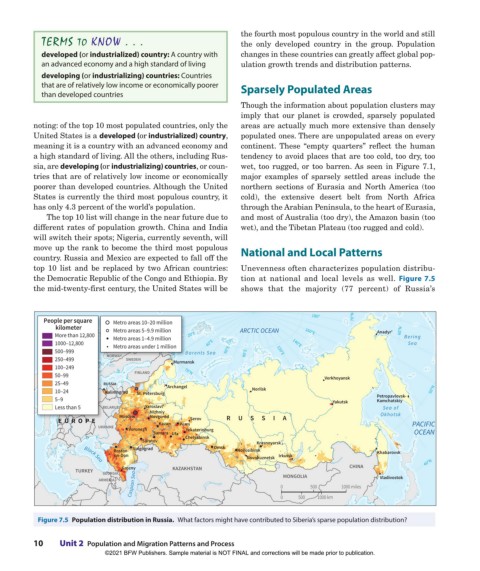
top 10 list and be replaced by two African countries: Unevenness often characterizes population distribu-
the Democratic Republic of the Congo and Ethiopia. By tion at national and local levels as well. Figure 7.5
the mid-twenty-first century, the United States will be shows that the majority (77 percent) of Russia’s
People per square Metro areas 10–20 million 0° 0° 0° 0° 0° 0° 0° 0° 0° 0° 0° 0° 0° 0° 0° 0° 0° 0° 0° 0° 0° 0° 0° 0° 0° 0° 0° 0° 0° 0° 0° 0° 0° 0° 0° 0° 0° 0° 0° 0° 0° 0° 0° 0° 0° 0° 0° 0° 0° 0° 0° 0° 0° 0° 0° 0° 0° 0° 0° 0° 0° 0° 0° 0° 0° 0° 0° 0° 0° 0° 0° 0° 0° 0° 0° 0° 0° 0° 0° 0° 0° 0° 0° 0° 0° 0° 0° 0° 0° 0° 0° 0° 0° 0° 0° 0° 0° 0° 0° 0° 0° 0° 0° 0° 0° 0° 0° 0° 0° 0° 0° 0° 0° 0° 0° 0° 0° 0° 0° 0° 0° 0° 0° 0° 0° 0° 0° 0° 0° 0° 0° 0° 0° 180° 70°N
kilometer Metro areas 5–9.9 million ARCTIC OCEAN
20°E
20°E
More than 12,800 Metro areas 1–4.9 million 20°E 160°E Anadyr' 60°N Bering
1000–12,800 60°N Metro areas under 1 million 40°E 140°E Sea
60°N
60°N
60°N
60°N
60°N
60°N
60°N
60°N
60°N
60°N
60°N
60°N
60°N
60°N
60°N
60°N
60°N
60°N
60°N
60°N
60°N
60°N
60°N
60°N
60°N
60°N
60°N
60°N
60°N
60°N
60°N
60°N
60°N
60°N
60°N
60°N
60°N
60°N
60°N
60°N
60°N
60°N
60°N
60°N
60°N
60°N
60°N
60°N
60°N
60°N
60°N
60°N
60°N
60°N
60°N
60°N
60°N
60°N
60°N
60°N
60°N
60°N
60°N
60°N
60°N
60°N
60°N
60°N
60°N
60°N
60°N
60°N
60°N
60°N
60°N
60°N
60°N
60°N
60°N
60°N
60°N
60°N
60°N
60°N
60°N
60°N
60°N
60°N
60°N
60°N
60°N
60°N
60°N
60°N
60°N
60°N
60°N
60°N
60°N
60°N
60°N
60°N
60°N
60°N
60°N
60°N
60°N
60°N
60°N
60°N
60°N
60°N
60°N
60°N
60°N
60°N
60°N
60°N
60°N
60°N
60°N
60°N
60°N
60°N
60°N
60°N
60°N
60°N
60°N
60°N
60°N
60°N
60°N
60°N
60°N
60°N
60°N
60°N
60°N
60°N
60°N
60°N
60°N
60°N
60°N
60°N
60°N
60°N
60°N
60°N
60°N
60°N
60°N
60°N
60°N
60°N
60°N
60°N
60°N
60°N
60°N
60°N
60°N
60°N
60°N
60°N
60°N
60°N
60°N
60°N
60°N
60°N
60°N
60°N
60°N
60°N
60°N
60°N
60°N
60°N
60°N
60°N
60°N
60°N
60°N
60°N
60°N
60°N
60°N
60°N
60°N
60°N
60°N
60°N
500–999 Barents Sea 60°E 80°E 120°E
Barents Sea
Barents Sea
Barents Sea
Barents Sea
Barents Sea
Barents Sea
Barents Sea
Barents Sea
Barents Sea
Barents Sea
Barents Sea
Barents Sea
Barents Sea
Barents Sea
Barents Sea
Barents Sea
Barents Sea
Barents Sea
Barents Sea
Barents Sea
Barents Sea
Barents Sea
Barents Sea
Barents Sea
Barents Sea
Barents Sea
Barents Sea
Barents Sea
Barents Sea
Barents Sea
Barents Sea
Barents Sea
Barents Sea
Barents Sea
Barents Sea
Barents Sea
Barents Sea
Barents Sea
Barents Sea
Barents Sea
Barents Sea
Barents Sea
Barents Sea
Barents Sea
Barents Sea
Barents Sea
Barents Sea
Barents Sea
Barents Sea
Barents Sea
Barents Sea
Barents Sea
Barents Sea
Barents Sea
NORWAY
250–499 NORWAY SWEDEN Murmansk
SWEDEN
100–249
50–99 FINLAND 70°N Verkhoyansk
25–49 RUSSIA Archangel
RUSSIA
10–24 Kaliningrad St. Petersburg Norilsk 50°N
5–9 Yakutsk Petropavlovsk-
Kamchatskiy
Less than 5 BELARUS Yaroslavl' Sea of
BELARUS
Nizhniy
Moscow Novgorod R U S S I A Okhotsk
EUROPE
EUROPE
EUROPE
EUROPE
EUROPE
EUROPE
EUROPE
EUROPE
EUROPE
EUROPE
EUROPE
EUROPE
EUROPE
EUROPE
EUROPE
EUROPE
EUROPE
EUROPE
EUROPE
EUROPE
EUROPE
EUROPE
EUROPE
EUROPE
EUROPE
EUROPE
EUROPE
EUROPE
EUROPE
EUROPE
EUROPE
EUROPE Serov
EUROPE
EUROPE
EUROPE
EUROPE
EUROPE
EUROPE
EUROPE
EUROPE
EUROPE
EUROPE
EUROPE
UKRAINE Kazan Perm PACIFIC
Voronezh Yekaterinburg
Samara Ufa OCEAN
Saratov Chelyabinsk Krasnoyarsk
Rostov- Volgograd Omsk Novosibirsk Khabarovsk
on-Don Irkutsk
Novokuznetsk 40°N
Black Sea
TURKEY Grozny KAZAKHSTAN CHINA
Caspian Sea 0 0 500 500 1000 km 1000 miles
GEORGIA MONGOLIA
ARMENIA Vladivostok
Figure 7.5 Population distribution in Russia. What factors might have contributed to Siberia’s sparse population distribution?
10 Unit 2 Population and Migration Patterns and Process
©2021 BFW Publishers. Sample material is NOT FINAL and corrections will be made prior to publication.
02_Hildebrhgap1e_19224_unit02_002_131_4pp.indd 10 05/19/20 6:02 PM