Page 23 - bfw-APHG-1e
P. 23

NEW YORK
                              Mean center of U.S. population  Lake
                                             WISCONSIN
                                                ONSIN
                                             WISC
                                             WISCONSIN
                              State border   WISC ONSIN   Michigan
                                                       Michigan
                                                       Michigan
                                                       Michigan
                                                       Michigan
                                                               MICHIGAN      Lake Erie
                                 IOWA             Chicago                                PENNSYLVANIA         New York
                                                                                                            NEW     40°N
                                                           INDIANA        OHIO         Pittsburgh  Philadelphia  JERSEY
                                                ILLINOIS                   Columbus            MARYLAND
                                                         Indianapolis                        1810  1800  1790
                                                                                                          DELAWARE
                               MISSOURI  Mississippi R.  1920  1900  Cincinnati  1870  1860  1840 1830 1820  Washington D.C.
                                                       1930      1890  1880       1850                       ATLANTIC
                                                    1950     1910
                                                                                 Charleston
                                         St Louis  1960   1940                   WEST                         OCEAN
                                             1980 1970           Louisville    VIRGINIA
                                           1990             Ohio R.                          VIRGINIA      0  50  100 Miles
                                        2000                     KENTUCKY                                  0  50 100 Kilometers
                                     2010                                      APPALACHIAN  MOUNTAINS Richmond
                            Springfield                                                      NORTH        0  300  600 Miles  35°N
                                                         TENNESSEE                          CAROLINA      0  300  600 Kilometers
                                 ARKANSAS
                                                                                                        Area of map


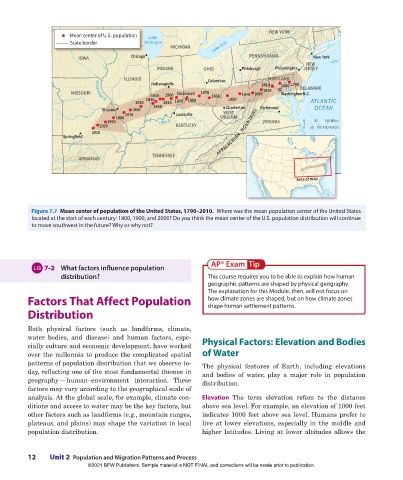
                  Figure 7.7  Mean center of population of the United States, 1790–2010.  Where was the mean population center of the United States
                  located at the start of each century: 1800, 1900, and 2000? Do you think the mean center of the U.S. population distribution will continue
                  to move southwest in the future? Why or why not?


                                                                                         Ti
                                                                            AP® Exam  Tip
                                                                            AP® Exam
                                                                                           p
                       7-2   What factors influence population
                           distribution?                                   This course requires you to be able to explain how human
                                                                           geographic patterns are shaped by physical geography.
                                                                           The explanation for this Module, then, will not focus on
                 Factors That Affect Population                            how climate zones are shaped, but on how climate zones
                                                                           shape human settlement patterns.
                 Distribution

                 Both physical factors (such as landforms, climate,
                   water bodies, and disease) and human factors, espe-    Physical Factors: Elevation and Bodies
                 cially culture and economic development, have worked
                 over the millennia to produce the complicated spatial  of Water
                 patterns of population distribution that we observe to-  The physical features of Earth, including elevations
                 day, reflecting one of the most fundamental themes in    and bodies of water, play a major role in population
                   geography — human–environment  interaction.  These      distribution.
                 factors may vary according to the geographical scale of
                 analysis. At the global scale, for example, climate con-  Elevation  The term elevation refers to the distance
                 ditions and access to water may be the key factors, but   above sea  level. For example, an elevation of 1000 feet
                 other factors such as landforms (e.g., mountain  ranges,   indicates 1000 feet above sea level. Humans prefer to
                 plateaus, and plains) may shape the variation in local   live at lower elevations, especially in the middle and
                  population distribution.                                higher latitudes. Living at lower altitudes allows the


                 12     Unit 2  Population and Migration Patterns and Process
                                    ©2021 BFW Publishers. Sample material is NOT FINAL and corrections will be made prior to publication.


          02_Hildebrhgap1e_19224_unit02_002_131_4pp.indd   12                                                                   05/19/20   6:03 PM
   18   19   20   21   22   23   24   25   26   27   28