
Page 22 - bfw-APHG-1e
P. 22
147 million people live in the European part of the
country, which accounts for less than 25 percent of TERMS TO KNOW . . .
Russia’s land area. The vast Asian part of Russia Snow Belt: States located in the northern and
(Siberia) has only 23 percent of the country’s total midwestern parts of the country
population. Likewise, the eastern part of the United Sunbelt: States in coastal areas and the South
States is more densely populated than the western and Southwest
part of the country, but this distribution pattern has mean center of population: The balancing point given
been changing. The Snow Belt states, located in the the distribution of population
northern and midwestern parts of the country, are
losing population, so the U.S. population is increas-
ingly shifting to coastal areas and to the south and a result of rapid population growth in Sunbelt states
southwest Sunbelt states, which stretch from Califor- such as Arizona and New Mexico. The 2010 mean cen-
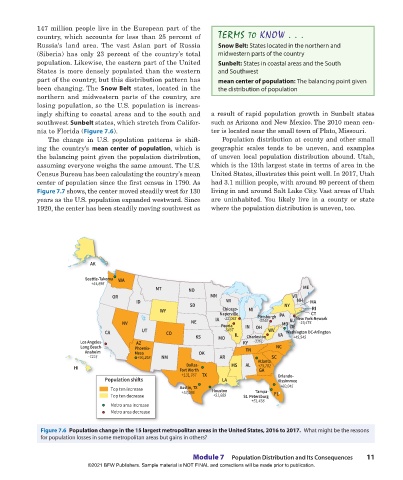
nia to Florida (Figure 7.6). ter is located near the small town of Plato, Missouri.
The change in U.S. population patterns is shift- Population distribution at county and other small
ing the country’s mean center of population, which is geographic scales tends to be uneven, and examples
the balancing point given the population distribution, of uneven local population distribution abound. Utah,
assuming everyone weighs the same amount. The U.S. which is the 13th largest state in terms of area in the
Census Bureau has been calculating the country’s mean United States, illustrates this point well. In 2017, Utah
center of population since the first census in 1790. As had 3.1 million people, with around 80 percent of them
Figure 7.7 shows, the center moved steadily west for 130 living in and around Salt Lake City. Vast areas of Utah
years as the U.S. population expanded westward. Since are uninhabited. You likely live in a county or state
1920, the center has been steadily moving southwest as where the population distribution is uneven, too.
AK
Seattle-Takoma WA
+54,898
MT ND ME
OR MN VT
ID WI NH MA
SD NY
WY Chicago- MI RI
Naperville Pittsburgh PA CT
-22,068
-5540
-19,474
NV NE IA Peoria IN OH MD NJ New York-Newark
DE
CA UT CO -3437 IL WV Washington DC-Arlington
KS MO Charleston VA +49,949
Los Angeles- AZ KY -3361
Long Beach- Phoenix- TN NC
Anaheim Mesa OK
-7223 +96,268 NM AR SC
Atlanta
Dallas- MS AL +75,702
HI Fort Worth GA
+131,767 TX Orlando-
Population shis LA Kissimmee
Top ten increase Austin, TX Houston Tampa- +60,045
Top ten decrease +53,086 +91,689 St. Petersburg FL
+51,438
Metro area increase
Metro area decrease
Figure 7.6 Population change in the 15 largest metropolitan areas in the United States, 2016 to 2017. What might be the reasons
for population losses in some metropolitan areas but gains in others?
Module 7 Population Distribution and Its Consequences 11
©2021 BFW Publishers. Sample material is NOT FINAL and corrections will be made prior to publication.
02_Hildebrhgap1e_19224_unit02_002_131_4pp.indd 11 05/19/20 6:02 PM