
Page 24 - bfw-APHG-1e
P. 24
inhabitants to avoid some of the colder weather at these valleys and basins were able to support larger popu-
latitudes. Most mountain ranges in these latitudes are lations in agricultural societies. The same is true of
sparsely populated. the major river valleys in East, South, and Southeast
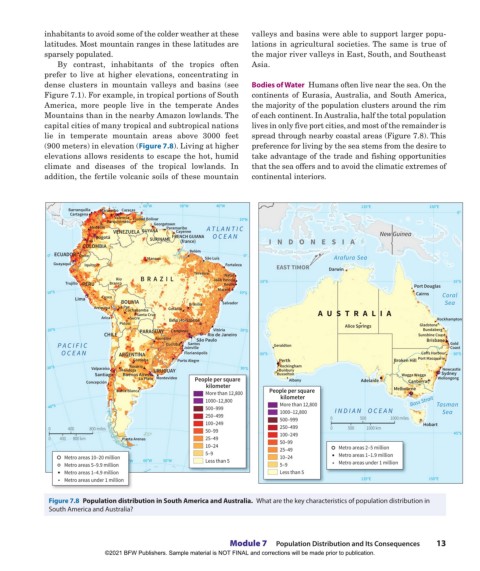
By contrast, inhabitants of the tropics often Asia.
prefer to live at higher elevations, concentrating in
dense clusters in mountain valleys and basins (see Bodies of Water Humans often live near the sea. On the
Figure 7.1). For example, in tropical portions of South continents of Eurasia, Australia, and South America,
America, more people live in the temperate Andes the majority of the population clusters around the rim
Mountains than in the nearby Amazon lowlands. The of each continent. In Australia, half the total population
capital cities of many tropical and subtropical nations lives in only five port cities, and most of the remainder is
lie in temperate mountain areas above 3000 feet spread through nearby coastal areas (Figure 7.8). This
(900 meters) in elevation (Figure 7.8). Living at higher preference for living by the sea stems from the desire to
elevations allows residents to escape the hot, humid take advantage of the trade and fishing opportunities
climate and diseases of the tropical lowlands. In that the sea offers and to avoid the climatic extremes of
addition, the fertile volcanic soils of these mountain continental interiors.
60°W 50°W 40°W 135°E 150°E
Barranquilla Maracaibo Caracas
Cartagena 0°
Valencia Ciudad Bolívar 10°N
Barquisimeto Georgetown
Medellín Paramaribo ATLANTIC
VENEZUELA GUYANA Cayenne New Guinea
Bogotá SURINAME FRENCH GUIANA OCEAN
Cali (france) INDONESIA
COLOMBIA
Belém
0° ECUADOR Quito 0° Arafura Sea
Manaus São Luís
Guayaquil Iquitos Fortaleza EAST TIMOR
Teresina Natal Darwin
Rio BRAZIL João Pessoa
Trujillo PERU Branco Recife 15°S Port Douglas 15°S
Maceió
10°S 10°S Cairns Coral
Lima Cusco
BOLIVIA Brasília Salvador Sea
Arequipa La Paz Goiânia
Cochabamba
Santa Cruz AUSTRALIA
Arica Sucre Belo Horizonte Rockhampton
Potosí Alice Springs Gladstone
20°S PARAGUAY Campinas Vitória 20°S Bundaberg
CHILE Rio de Janeiro Sunshine Coast
Asunción São Paulo Brisbane
Santos
PACIFIC Curitiba Joinville Geraldton Gold
Coast
OCEAN ARGENTINA Florianópolis 30°S Coffs Harbour 30°S
Córdoba Porto Alegre Perth Broken Hill Port Macquarie
Rockingham
30°S Valparaíso Mendoza URUGUAY 30°S Bunbury Newcastle
Rosario
Sydney
Santiago Buenos Aires Montevideo Busselton Wagga Wagga Wollongong
Concepción La Plata People per square Albany Adelaide Canberra
kilometer
Bahía Blanca More than 12,800 People per square Melbourne
1000–12,800 kilometer Bass Strait
40°S 500–999 More than 12,800 INDIAN OCEAN Tasman
250–499 1000–12,800 0 500 1000 miles Sea
500–999
100–249 Hobart
0 400 800 miles 50–99 250–499 0 500 1000 km 45°S
0 400 800 km Punta Arenas 25–49 100–249
50–99
10–24 25–49 120°E Metro areas 2–5 million
120°E
120°E
5–9 Metro areas 1–1.9 million
Metro areas 10–20 million 70°W 60°W 50°W 30°W 20°W 10–24
Less than 5
30°W
30°W
20°W
20°W
20°W
30°W
70°W
70°W
70°W
90°W
90°W
90°W
Metro areas 5–9.9 million 5–9 120°E Metro areas under 1 million
120°E
120°E
Metro areas 1–4.9 million Less than 5
Metro areas under 1 million 135°E 150°E
Figure 7.8 Population distribution in South America and Australia. What are the key characteristics of population distribution in
South America and Australia?
Module 7 Population Distribution and Its Consequences 13
©2021 BFW Publishers. Sample material is NOT FINAL and corrections will be made prior to publication.
02_Hildebrhgap1e_19224_unit02_002_131_4pp.indd 13 05/19/20 6:03 PM