
Page 35 - 2022-bfw-morris-1e
P. 35
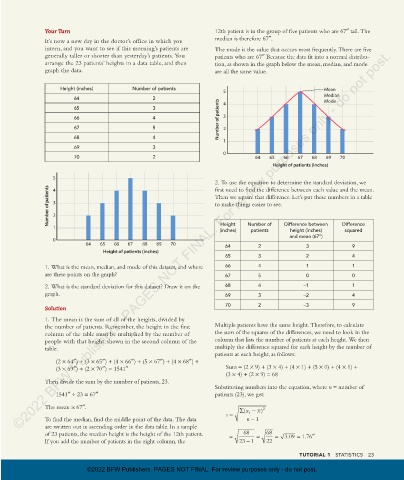
Your Turn                                               12th patient is in the group of five patients who are 67″ tall. The
                      It’s now a new day in the doctor’s office in which you    median is therefore 67″.
                      intern, and you want to see if this morning’s patients are   The mode is the value that occurs most frequently. There are five
             ©2022 BFW Publishers. PAGES NOT FINAL. For review purposes only - do not post.
                        generally taller or shorter than yesterday’s patients. You   patients who are 67″ Because the data fit into a normal distribu-
                      arrange the 23 patients’ heights in a data table, and then    tion, as shown in the graph below the mean, median, and mode
                      graph the data.                                         are all the same value.

                           Height (inches)         Number of patients                                             Mean
                                                                                 5
                                64                       2                                                        Median
                                                                                                                  Mode
                                65                       3                       4
                                66                       4                     Number of patients  3
                                67                       5                       2
                                68                       4
                                                                                 1
                                69                       3
                                                                                 0
                                70                       2                                 64   65  66   67   68  69   70
                                                                                                 Height of patients (inches)

                         5
                                                                              2. To use the equation to determine the standard deviation, we
                       Number of patients  3                                  Then we square that difference. Let’s put these numbers in a table
                                                                              first need to find the difference between each value and the mean.
                         4
                                                                              to make things easier to see.
                         2

                         1                                                      Height   Number of    Difference between   Difference
                                                                               (inches)   patients    height (inches)   squared
                                                                                                      and mean (67″)
                         0
                                   64   65   66  67   68   69  70
                                                                                 64         2               3              9
                                         Height of patients (inches)
                                                                                 65         3               2              4
                      1. What is the mean, median, and mode of this dataset, and where   66  4              1              1
                      are these points on the graph?                             67         5               0              0

                      2. What is the standard deviation for this dataset? Draw it on the   68  4           -1              1
                      graph.                                                     69         3              -2              4

                                                                                 70         2              -3              9
                      Solution
                      1. The mean is the sum of all of the heights, divided by
                      the number of patients. Remember, the height in the first   Multiple patients have the same height. Therefore, to calculate
                        column of the table must be multiplied by the number of   the sum of the squares of the differences, we need to look in the
                        people with that height, shown in the second column of the   column that lists the number of patients at each height. We then
                      table.                                                  multiply the difference squared for each height by the number of
                                                                              patients at each height, as follows:
                          (2 × 64″) + (3 × 65″) + (4 × 66″) + (5 × 67″) + (4 × 68″) +
                          (3 × 69″) + (2 × 70″) = 1541″                          Sum = (2 × 9) + (3 × 4) + (4 × 1) + (5 × 0) + (4 × 1) +
                                                                                 (3 × 4) + (2 × 9) = 68
                      Then divide the sum by the number of patients, 23.
                                                                              Substituting numbers into the equation, where n = number of
                          1541″ ÷ 23 = 67″                                    patients (23), we get:

                      The mean is 67″.                                                    − ) x  2
                                                                                 s  =  ∑(x i
                      To find the median, find the middle point of the data. The data   n  − 1
                      are written out in ascending order in the data table. In a sample
                      of 23 patients, the median height is the height of the 12th patient.   =  68  =  68  = 3.09  = 1.76 ″
                      If you add the number of patients in the right column, the      23  − 1  22
                                                                                                          TUTORIAL 1   STATISTICS   23

                                    ©2022 BFW Publishers. PAGES NOT FINAL. For review purposes only - do not post.


          03_morrisapbiology1e_11331_Unit1_Tut1_20-25_3pp.indd   23                                                             10/04/21   9:13 AM