
Page 33 - 2022-bfw-morris-1e
P. 33
values. One or two outliers can affect the mean much more than To determine the mode, it helps to look at the values in ascend-
the median. As a result, in this case, the median might be more ing order, as we did when determining the median. Count how
representative of a group of values than the mean. many instances there are of each value. Five patients have a height
©2022 BFW Publishers. PAGES NOT FINAL. For review purposes only - do not post.
of 65″, more than any other height. Therefore, the mode of the
To find the median of a dataset, list the values of the dataset in
numerical order and identify the value in the middle of the list. If heights of the morning’s patients is 65″.
there is an even number of values, the median is the mean of the See page 12 for “Analyzing Statistics and Data: Averages” which
two middle values. gives you the opportunity to apply these concepts in context.
Example: Let’s use the dataset from the previous example. We deter- The mean, median, and mode provide different ways to describe
mine the median by first putting the nine values in numerical order: or characterize datasets. In a way, they are all averages, but which
one you use depends on if you want to weigh all of the values
1, 1, 4, 5, 5, 5, 6, 9, 9
equally (mean), if you want the value in the middle (median), or
The number in the fifth position, 5, is the median because there if you want the value that is most common (mode).
are four values on either side of it. Note that, in this case, the
median (5) and the mean (6) are not the same. Spread of Data: Normal
Mode Distribution, Range, and
Standard Deviation
A third type of average is the mode, which is the value that
shows up most frequently in all the measurements. he numbers that result from the multiple repetitions of each
Texperiment involving multiple measurements or observations
Example: Taking the dataset 5, 9, 4, 6, 5, 1, 5, 9, 1, 9 once again,
the mode is 5 because it occurs three times, which is more than are typically not the same, as we discussed earlier. Instead, they
any of the other values. may differ from one another, and on a graph will appear scattered.
Experimental results may differ because conditions typically vary
Your Turn in some subtle way from one experiment to the next, individ-
uals differ from one another, and the situations change slightly
While interning at a doctor’s office, you record the heights of the
first 20 patients of the day: over the course of time. In this section, we will look at ways to
visualize, calculate, and communicate the distribution of data.
60″, 72″, 75″, 63″, 62″, 67″ 65″, 65″, 63″, 65″,
67″, 68″, 65″, 69″, 68″, 70″, 67″, 69″, 65″, 63″ Normal Distribution
What are the mean, median, and mode of the heights of the The spread of all the numbers in experimental results is described
morning’s patients?
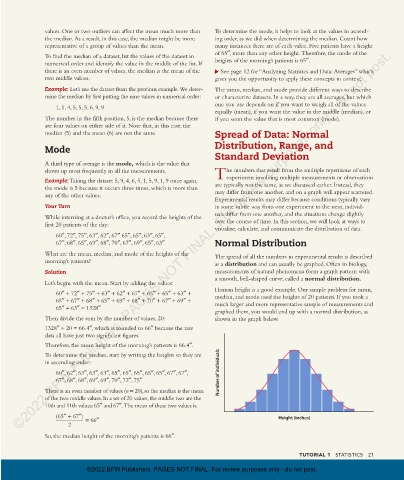
as a distribution and can usually be graphed. Often in biology,
Solution measurements of natural phenomena form a graph pattern with
a smooth, bell-shaped curve, called a normal distribution.
Let’s begin with the mean. Start by adding the values:
Human height is a good example. Our sample problem for mean,
60″ + 72″ + 75″ + 63″ + 62″ + 67″ + 65″ + 65″ + 63″ + median, and mode used the heights of 20 patients. If you took a
65″ + 67″ + 68″ + 65″ + 69″ + 68″ + 70″ + 67″ + 69″ + much larger and more representative sample of measurements and
65″ + 63″ = 1328″
graphed them, you would end up with a normal distribution, as
Then divide the sum by the number of values, 20: shown in the graph below.
1328″ ÷ 20 = 66.4″, which is rounded to 66″ because the raw
data all have just two significant figures.
Therefore, the mean height of the morning’s patients is 66.4″.
To determine the median, start by writing the heights so they are
in ascending order:
60″, 62″, 63″, 63″, 63″, 65″, 65″, 65″, 65″, 65″, 67″, 67″, Number of individuals
67″, 68″, 68″, 69″, 69″, 70″, 72″, 75″
There is an even number of values (n = 20), so the median is the mean
of the two middle values. In a set of 20 values, the middle two are the
10th and 11th values: 65″ and 67″. The mean of these two values is:
″
(65 ″+ 67) = 66 ″ Height (inches)
2
So, the median height of the morning’s patients is 66″.
TUTORIAL 1 STATISTICS 21
©2022 BFW Publishers. PAGES NOT FINAL. For review purposes only - do not post.
03_morrisapbiology1e_11331_Unit1_Tut1_20-25_3pp.indd 21 10/04/21 9:13 AM