
Page 37 - 2022-bfw-morris-1e
P. 37
®
data point. For example, in Module 0, we examined the rela- In AP Biology, error bars usually represent the mean plus or
tionship between caffeine consumption and resting heart rate. minus two standard errors of the mean. This range of values is
The results for each group of people were averaged and graphed sometimes called the 95% confidence interval because, in 95%
©2022 BFW Publishers. PAGES NOT FINAL. For review purposes only - do not post.
in Figure 0.8. The vertical line across each point in the graph of the samples, the confidence interval includes the true mean.
represents the error bar.
As we discussed in Module 0, scientists often use a threshold
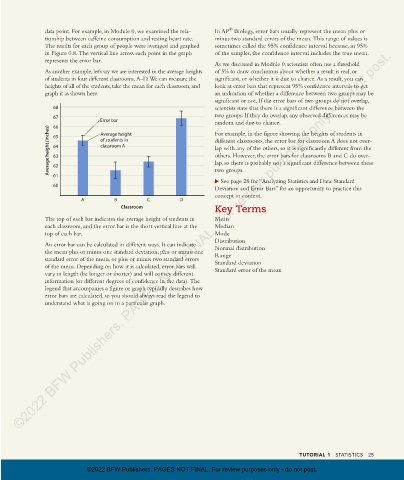
As another example, let’s say we are interested in the average heights of 5% to draw conclusions about whether a result is real, or
of students in four different classrooms, A–D. We can measure the significant, or whether it is due to chance. As a result, you can
heights of all of the students, take the mean for each classroom, and look at error bars that represent 95% confidence intervals to get
graph it as shown here. an indication of whether a difference between two groups may be
significant or not. If the error bars of two groups do not overlap,
68 scientists state that there is a significant difference between the
67 two groups. If they do overlap, any observed differences may be
Error bar random and due to chance.
66
Average height (inches) 65 of students in different classrooms, the error bar for classroom A does not over-
For example, in the figure showing the heights of students in
Average height
classroom A
64
lap with any of the others, so it is significantly different from the
others. However, the error bars for classrooms B and C do over-
63
lap, so there is probably not a significant difference between these
62
two groups.
61
See page 28 for “Analyzing Statistics and Data: Standard
60
Deviation and Error Bars” for an opportunity to practice this
concept in context.
A B C D
Classroom Key Terms
The top of each bar indicates the average height of students in Mean
each classroom, and the error bar is the short vertical line at the Median
top of each bar. Mode
Distribution
An error bar can be calculated in different ways. It can indicate Normal distribution
the mean plus or minus one standard deviation, plus or minus one Range
standard error of the mean, or plus or minus two standard errors Standard deviation
of the mean. Depending on how it is calculated, error bars will Standard error of the mean
vary in length (be longer or shorter) and will convey different
information (or different degrees of confidence in the data). The
legend that accompanies a figure or graph typically describes how
error bars are calculated, so you should always read the legend to
understand what is going on in a particular graph.
TUTORIAL 1 STATISTICS 25
©2022 BFW Publishers. PAGES NOT FINAL. For review purposes only - do not post.
03_morrisapbiology1e_11331_Unit1_Tut1_20-25_3pp.indd 25 10/04/21 9:13 AM