
Page 36 - 2022-bfw-morris-1e
P. 36
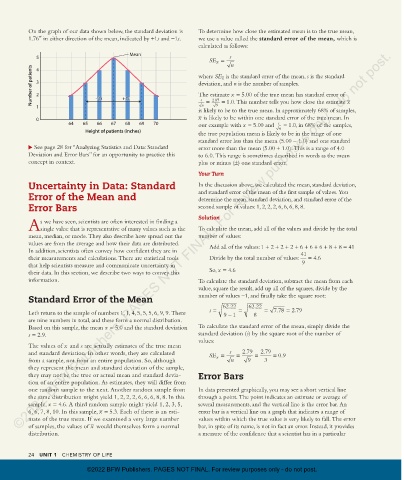
On the graph of our data shown below, the standard deviation is   To determine how close the estimated mean is to the true mean,
                 1.76″ in either direction of the mean, indicated by +1s and -1s.  we use a value called the standard error of the mean, which is
                                                                        calculated as follows:
             ©2022 BFW Publishers. PAGES NOT FINAL. For review purposes only - do not post.
                                                  Mean                             s
                   5
                                                                            SE x  =  n
                  Number of patients  3 2                               where SE  is the standard error of the mean, s is the standard
                   4
                                                                                x
                                                                        deviation, and n is the number of samples.
                                                                        The estimate  = 5.00 of the true mean has standard error of
                                                                                   x
                                       –1s
                                               +1
                                                                              9
                   1                   –1s     +1s s                     s n  =  2.87  = 1.0. This number tells you how close the estimate x
                                                                        is likely to be to the true mean. In approximately 68% of samples,
                   0                                                    x is likely to be within one standard error of the true mean. In
                              64  65   66   67  68   69   70            our example with  = 5.00 and   s  = 1.0, in 68% of the samples,
                                                                                       x
                                   Height of patients (inches)                                     n
                                                                        the true population mean is likely to be in the range of one
                                                                          standard error less than the mean (5.00 - 1.0) and one standard
                   See page 28 for “Analyzing Statistics and Data: Standard   error more than the mean (5.00 + 1.0). This is a range of 4.0
                   Deviation and Error Bars” for an opportunity to practice this   to 6.0. This range is sometimes described in words as the mean
                 concept in context.                                    plus or minus (±) one standard error.
                                                                        Your Turn
                 Uncertainty in Data: Standard                          In the discussion above, we calculated the mean, standard  deviation,
                 Error of the Mean and                                  and standard error of the mean of the first sample of values. You
                                                                        determine the mean, standard deviation, and standard error of the
                 Error Bars                                             second sample of values: 1, 2, 2, 2, 6, 6, 6, 8, 8.

                                                                        Solution
                     s we have seen, scientists are often interested in finding a
                 Asingle value that is representative of many values such as the   To calculate the mean, add all of the values and divide by the total
                 mean, median, or mode. They also describe how spread out the   number of values:
                 values are from the average and how their data are distributed.   Add all of the values: 1 + 2 + 2 + 2 + 6 + 6 + 6 + 8 + 8 = 41
                 In addition, scientists often convey how confident they are in                           41
                 their measurements and calculations. There are statistical tools   Divide by the total number of values:   = 4.6
                 that help scientists measure and communicate uncertainty in                              9
                                                                               x
                 their data. In this section, we describe two ways to convey this   So,  = 4.6
                 information.                                           To calculate the standard deviation, subtract the mean from each
                                                                        value, square the result, add up all of the squares, divide by the
                 Standard Error of the Mean                             number of values -1, and finally take the square root:
                                                                                62.22    62.22
                 Let’s return to the sample of numbers 1, 1, 4, 5, 5, 5, 6, 9, 9. There   s  =  9  − 1  =  8  = 7.78  = 2.79
                 are nine numbers in total, and these form a normal distribution.
                                          x
                 Based on this sample, the mean  = 5.0 and the standard deviation   To calculate the standard error of the mean, simply divide the
                 s  = 2.9.                                              standard deviation (s) by the square root of the number of
                                                                        values:
                 The values of x and s are actually estimates of the true mean
                 and standard deviation. In other words, they are calculated   SE  =  s  =  2.79  =  2.79  = 0.9
                 from a sample, not from an entire population. So, although   x    n     9    3
                 they represent the mean and standard deviation of the sample,
                 they may not be the true or actual mean and standard devia-  Error Bars
                 tion of an entire  population. As estimates, they will differ from
                 one random sample to the next. Another random sample from   In data presented graphically, you may see a short vertical line
                 the same distribution might yield 1, 2, 2, 2, 6, 6, 6, 8, 8. In this   through a point. The point indicates an estimate or average of
                 sample,  = 4.6. A third random sample might yield 1, 2, 3, 5,     several measurements, and the vertical line is the error bar. An
                       x
                 6, 6, 7, 8, 10. In this  sample,  = 5.3. Each of these is an esti-  error bar is a vertical line on a graph that indicates a range of
                                        x
                 mate of the true mean. If we examined a very large number   values within which the true value is very likely to fall. The error
                 of samples, the values of x would themselves form a normal   bar, in spite of its name, is not in fact an error. Instead, it provides
                 distribution.                                          a measure of the confidence that a scientist has in a  particular


                 24   UNIT 1   CHEMISTRY OF LIFE

                                    ©2022 BFW Publishers. PAGES NOT FINAL. For review purposes only - do not post.


          03_morrisapbiology1e_11331_Unit1_Tut1_20-25_3pp.indd   24                                                             10/04/21   9:13 AM