
Page 59 - 2024-bfw-MyersAP4e
P. 59
Module 1.4a
Newer neuroimaging techniques give us a superhero-like ability to see inside the
living brain. For example, the CT (computed tomography) scan examines the brain
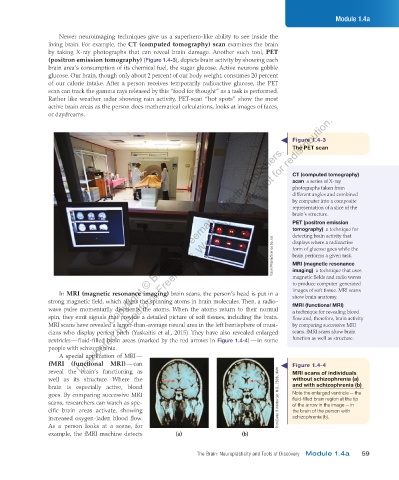
by taking X-ray photographs that can reveal brain damage. Another such tool, PET
(positron emission tomography) (Figure 1.4-3), depicts brain activity by showing each
brain area’s consumption of its chemical fuel, the sugar glucose. Active neurons gobble
glucose. Our brain, though only about 2 percent of our body weight, consumes 20 percent
of our calorie intake. After a person receives temporarily radioactive glucose, the PET
scan can track the gamma rays released by this “food for thought” as a task is performed.
Rather like weather radar showing rain activity, PET-scan “hot spots” show the most
active brain areas as the person does mathematical calculations, looks at images of faces,
or daydreams.
Distributed by Bedford, Freeman & Worth Publishers. Not for redistribution.
Figure 1.4-3
Copyright © Bedford, Freeman & Worth Publishers.
The PET scan
CT (computed tomography)
scan a series of X-ray
photographs taken from
different angles and combined
by computer into a composite
representation of a slice of the
brain’s structure.
PET (positron emission
tomography) a technique for
detecting brain activity that
Voisin/Phanie/Science Source form of glucose goes while the
displays where a radioactive
brain performs a given task.
MRI (magnetic resonance
imaging) a technique that uses
magnetic fields and radio waves
to produce computer-generated
images of soft tissue. MRI scans
In MRI (magnetic resonance imaging) brain scans, the person’s head is put in a show brain anatomy.
strong magnetic field, which aligns the spinning atoms in brain molecules. Then, a radio-
wave pulse momentarily disorients the atoms. When the atoms return to their normal fMRI (functional MRI)
a technique for revealing blood
spin, they emit signals that provide a detailed picture of soft tissues, including the brain. flow and, therefore, brain activity
MRI scans have revealed a larger-than-average neural area in the left hemisphere of musi- by comparing successive MRI
cians who display perfect pitch (Yuskaitis et al., 2015). They have also revealed enlarged scans. fMRI scans show brain
ventricles — fluid-filled brain areas (marked by the red arrows in Figure 1.4-4) — in some function as well as structure.
people with schizophrenia.
A special application of MRI —
fMRI (functional MRI) — can Figure 1.4-4
reveal the brain’s functioning as MRI scans of individuals
well as its structure. Where the without schizophrenia (a)
brain is especially active, blood and with schizophrenia (b)
goes. By comparing successive MRI From Daniel R Weinberger, M.D., CBDB, NIMH Note the enlarged ventricle — the
scans, researchers can watch as spe- fluid-filled brain region at the tip
of the arrow in the image — in
cific brain areas activate, showing the brain of the person with
increased oxygen-laden blood flow. schizophrenia (b).
As a person looks at a scene, for
example, the fMRI machine detects (a) (b)
The Brain: Neuroplasticity and Tools of Discovery Module 1.4a 59
03_myersAPpsychology4e_28116_ch01_002_163.indd 59 15/12/23 9:22 AM