
Page 17 - 2023-bfw-Macro-Krugman-Econ-4e
P. 17
7. The allocation of resources in the economy is inefficient d. at the points on a production possibilities curve that
a. at every point along a production possibilities curve. intersect the axes.
b. at every point above a production possibilities curve. e. at points along a production possibilities curve that
c. at every point below a production possibilities curve. make consumers as well off as possible.
®
Tackle the AP Test: Free-Response Questions
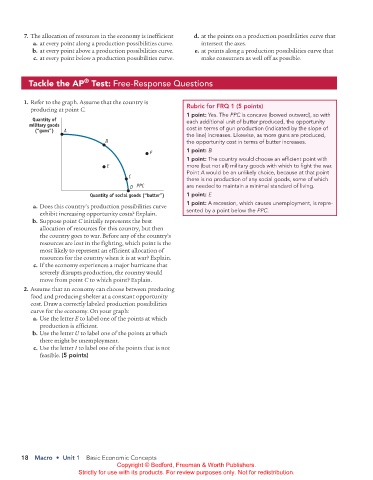
1. Refer to the graph. Assume that the country is
producing at point C. Rubric for FRQ 1 (5 points)
1 point: Yes. The PPC is concave (bowed outward), so with
Quantity of each additional unit of butter produced, the opportunity
military goods
(“guns”) A cost in terms of gun production (indicated by the slope of
the line) increases. Likewise, as more guns are produced,
B the opportunity cost in terms of butter increases.
F 1 point: B
1 point: The country would choose an efficient point with
E more (but not all) military goods with which to fight the war.
Point A would be an unlikely choice, because at that point
C
there is no production of any social goods, some of which
D PPC are needed to maintain a minimal standard of living.
Quantity of social goods (“butter”) 1 point: E
1 point: A recession, which causes unemployment, is repre-
a. Does this country’s production possibilities curve
exhibit increasing opportunity costs? Explain. sented by a point below the PPC.
b. Suppose point C initially represents the best
allocation of resources for this country, but then
the country goes to war. Before any of the country’s
resources are lost in the fighting, which point is the
most likely to represent an efficient allocation of
resources for the country when it is at war? Explain.
c. If the economy experiences a major hurricane that
severely disrupts production, the country would
move from point C to which point? Explain.
2. Assume that an economy can choose between producing
food and producing shelter at a constant opportunity
cost. Draw a correctly labeled production possibilities
curve for the economy. On your graph:
a. Use the letter E to label one of the points at which
production is efficient.
b. Use the letter U to label one of the points at which
there might be unemployment.
c. Use the letter I to label one of the points that is not
feasible. (5 points)
18 Macro • Unit 1 Basic Economic Concepts
Copyright © Bedford, Freeman & Worth Publishers.
Strictly for use with its products. For review purposes only. Not for redistribution.
02_APKrugman4e_40932_MacroU01_002_062.indd 18 05/07/22 10:50 AM