
Page 14 - 2023-bfw-Macro-Krugman-Econ-4e
P. 14
ModULE 1.2
two goods are leather belts and leather hats, pizzas and calzones, or cappuccinos and
lattes. When there is no specialization of resources, the opportunity cost of each unit
remains the same as more of a good is made. For example, assuming that two leather
belts could be made with the labor, leather, and other resources needed to make one
leather hat, the opportunity cost of each leather hat is two belts. When no resources are
specialized for the production of either good, the production possibilities curve is a
straight, downward-sloping line like the one in Figure 1.2-1.
Economic Growth
Finally, the production possibilities curve helps us understand what it means to talk
about economic growth, which is an increase in the maximum possible output of Economic growth is an increase
an economy. When are we justified in saying that an economy has grown over time? in the maximum amount of
After all, although the U.S. economy today produces more of many things than it did goods and services an economy
a century ago, it produces less of other things, such as horse-drawn carriages. In other can produce.
words, production of many goods is actually down. So how can we say for sure that the
economy as a whole has grown?
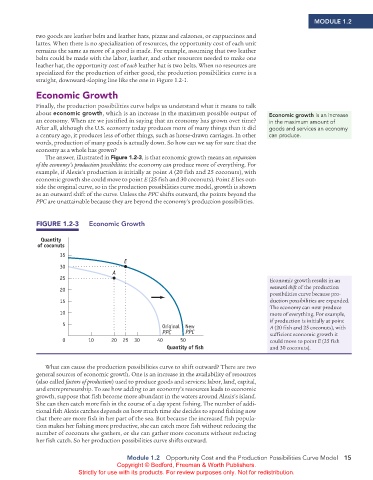
The answer, illustrated in Figure 1.2-3, is that economic growth means an expansion
of the economy’s production possibilities: the economy can produce more of everything. For
example, if Alexis’s production is initially at point A (20 fish and 25 coconuts), with
economic growth she could move to point E (25 fish and 30 coconuts). Point E lies out-
side the original curve, so in the production possibilities curve model, growth is shown
as an outward shift of the curve. Unless the PPC shifts outward, the points beyond the
PPC are unattainable because they are beyond the economy’s production possibilities.
FIGURE 1.2-3 Economic Growth
Quantity
of coconuts
35
E
30
A
25 Economic growth results in an
20 outward shift of the production
possibilities curve because pro-
15 duction possibilities are expanded.
The economy can now produce
10 more of everything. For example,
if production is initially at point
5 Original New A (20 fish and 25 coconuts), with
PPC PPC sufficient economic growth it
0 10 20 25 30 40 50 could move to point E (25 fish
Quantity of sh and 30 coconuts).
What can cause the production possibilities curve to shift outward? There are two
general sources of economic growth. One is an increase in the availability of resources
(also called factors of production) used to produce goods and services: labor, land, capital,
and entrepreneurship. To see how adding to an economy’s resources leads to economic
growth, suppose that fish become more abundant in the waters around Alexis’s island.
She can then catch more fish in the course of a day spent fishing. The number of addi-
tional fish Alexis catches depends on how much time she decides to spend fishing now
that there are more fish in her part of the sea. But because the increased fish popula-
tion makes her fishing more productive, she can catch more fish without reducing the
number of coconuts she gathers, or she can gather more coconuts without reducing
her fish catch. So her production possibilities curve shifts outward.
Module 1.2 Opportunity Cost and the Production Possibilities Curve Model 15
Copyright © Bedford, Freeman & Worth Publishers.
Strictly for use with its products. For review purposes only. Not for redistribution.
02_APKrugman4e_40932_MacroU01_002_062.indd 15 05/07/22 10:50 AM